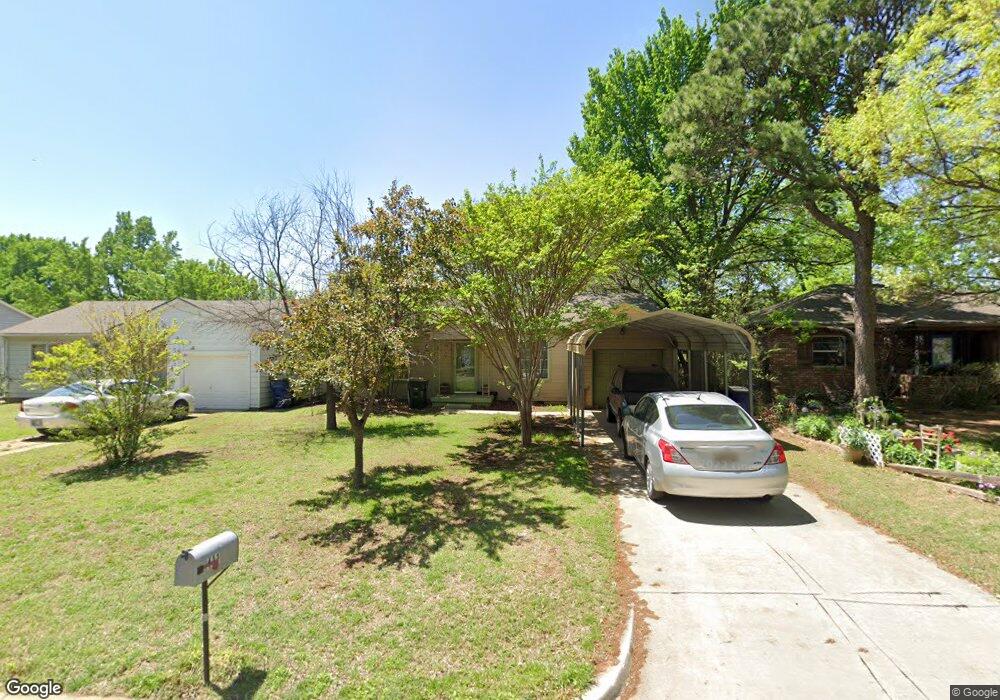
411 N D St Duncan, OK 73533
Estimated Value: $25,769 - $79,000
2
Beds
1
Bath
893
Sq Ft
$53/Sq Ft
Est. Value
About This Home
This home is located at 411 N D St, Duncan, OK 73533 and is currently estimated at $47,442, approximately $53 per square foot. 411 N D St is a home located in Stephens County with nearby schools including Woodrow Wilson Elementary School, Duncan Middle School, and Duncan High School.
Ownership History
Date
Name
Owned For
Owner Type
Purchase Details
Closed on
Sep 15, 2025
Sold by
Toms Timothy James and Martin Lynda Kay
Bought by
Holthe Samuel A and Holthe Rose Marie
Current Estimated Value
Purchase Details
Closed on
Oct 16, 2023
Sold by
Bolton Dustin and Bolton Carol
Bought by
Neal L Moore And Valerie L Moore Family Trust and Moore
Purchase Details
Closed on
Jan 30, 2008
Sold by
Jones Billie R and Jones Sheila J
Bought by
Toms Timothy James and Martin Lynda Kay
Home Financials for this Owner
Home Financials are based on the most recent Mortgage that was taken out on this home.
Original Mortgage
$30,000
Interest Rate
6.07%
Mortgage Type
New Conventional
Purchase Details
Closed on
Mar 31, 2003
Sold by
Mcwhirter Patricia
Purchase Details
Closed on
Jan 11, 1993
Sold by
Graham Albert Melvin
Create a Home Valuation Report for This Property
The Home Valuation Report is an in-depth analysis detailing your home's value as well as a comparison with similar homes in the area
Purchase History
We collect this data history from publicly available records. To have your information removed, we recommend requesting removal directly through your county’s website.
| Date | Buyer | Sale Price | Title Company |
|---|---|---|---|
| Holthe Samuel A | $27,500 | Stephens County Abstract | |
| Neal L Moore And Valerie L Moore Family Trust | $25,000 | None Listed On Document | |
| Toms Timothy James | $36,000 | Stewart Abstract & Title | |
| -- | -- | -- | |
| -- | -- | -- |
Source: Public Records
Mortgage History
We collect this data history from publicly available records. To have your information removed, we recommend requesting removal directly through your county’s website.
| Date | Status | Borrower | Loan Amount |
|---|---|---|---|
| Previous Owner | Toms Timothy James | $30,000 |
Source: Public Records
Tax History
| Year | Tax Paid | Tax Assessment Tax Assessment Total Assessment is a certain percentage of the fair market value that is determined by local assessors to be the total taxable value of land and additions on the property. | Land | Improvement |
|---|---|---|---|---|
| 2025 | $476 | $5,644 | $317 | $5,327 |
| 2024 | $334 | $3,921 | $317 | $3,604 |
| 2023 | $334 | $3,922 | $317 | $3,605 |
| 2022 | $302 | $3,735 | $317 | $3,418 |
| 2021 | $302 | $3,557 | $317 | $3,240 |
| 2020 | $279 | $3,227 | $317 | $2,910 |
| 2019 | $266 | $3,073 | $317 | $2,756 |
| 2018 | $261 | $2,927 | $317 | $2,610 |
| 2017 | $259 | $3,019 | $317 | $2,702 |
| 2016 | $360 | $4,236 | $317 | $3,919 |
| 2015 | $352 | $4,044 | $317 | $3,727 |
| 2014 | $352 | $3,852 | $440 | $3,412 |
Source: Public Records
Map
Nearby Homes
Your Personal Tour Guide
Ask me questions while you tour the home.