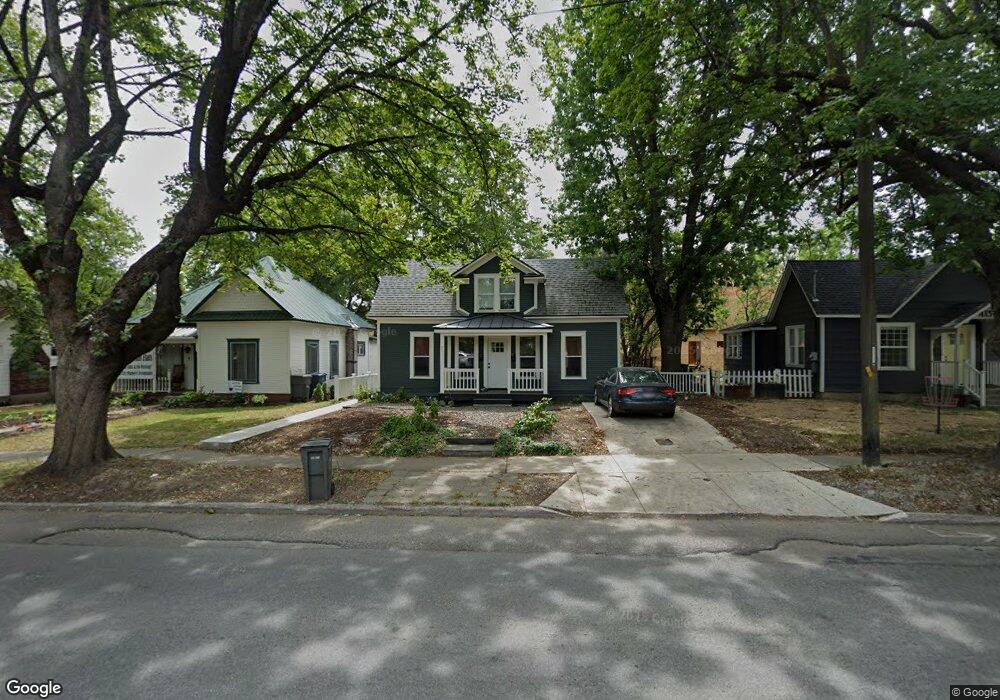
411 Pine St Unit A&B Sandpoint, ID 83864
Estimated Value: $572,193 - $956,000
3
Beds
4
Baths
1,933
Sq Ft
$364/Sq Ft
Est. Value
About This Home
This home is located at 411 Pine St Unit A&B, Sandpoint, ID 83864 and is currently estimated at $703,798, approximately $364 per square foot. 411 Pine St Unit A&B is a home located in Bonner County with nearby schools including Farmin Stidwell Elementary School, Sandpoint Middle School, and Sandpoint High School.
Ownership History
Date
Name
Owned For
Owner Type
Purchase Details
Closed on
Feb 23, 2023
Sold by
Sand Creek Property Management Services
Bought by
Lindholm Theresa and Lindholm Cory
Current Estimated Value
Home Financials for this Owner
Home Financials are based on the most recent Mortgage that was taken out on this home.
Original Mortgage
$411,750
Outstanding Balance
$398,831
Interest Rate
6.33%
Mortgage Type
New Conventional
Estimated Equity
$304,967
Purchase Details
Closed on
Sep 29, 2017
Sold by
Scruggs Gary
Bought by
Sand Creek Porperty Management Services
Purchase Details
Closed on
Mar 5, 2017
Sold by
Waterhouse Gloria Jennings
Bought by
Scruggs Gary
Purchase Details
Closed on
Mar 7, 2005
Sold by
Reid Cleland
Bought by
Bisbee Charles
Home Financials for this Owner
Home Financials are based on the most recent Mortgage that was taken out on this home.
Original Mortgage
$116,000
Interest Rate
5.53%
Mortgage Type
New Conventional
Create a Home Valuation Report for This Property
The Home Valuation Report is an in-depth analysis detailing your home's value as well as a comparison with similar homes in the area
Home Values in the Area
Average Home Value in this Area
Purchase History
| Date | Buyer | Sale Price | Title Company |
|---|---|---|---|
| Lindholm Theresa | -- | Titleone | |
| Sand Creek Porperty Management Services | -- | North Idaho Title Co | |
| Scruggs Gary | -- | North Idaho Title Company Sa | |
| Bisbee Charles | -- | First American Title |
Source: Public Records
Mortgage History
| Date | Status | Borrower | Loan Amount |
|---|---|---|---|
| Open | Lindholm Theresa | $411,750 | |
| Previous Owner | Bisbee Charles | $116,000 |
Source: Public Records
Tax History
| Year | Tax Paid | Tax Assessment Tax Assessment Total Assessment is a certain percentage of the fair market value that is determined by local assessors to be the total taxable value of land and additions on the property. | Land | Improvement |
|---|---|---|---|---|
| 2025 | $4,022 | $583,465 | $290,995 | $292,470 |
| 2024 | $3,797 | $553,625 | $261,155 | $292,470 |
| 2023 | $2,866 | $541,433 | $261,155 | $280,278 |
| 2022 | $2,398 | $380,648 | $181,909 | $198,739 |
| 2021 | $2,433 | $262,815 | $148,849 | $113,966 |
| 2020 | $2,102 | $225,517 | $113,190 | $112,327 |
| 2019 | $1,668 | $200,620 | $96,492 | $104,128 |
| 2018 | $2,061 | $160,318 | $96,492 | $63,826 |
| 2017 | $2,061 | $147,020 | $0 | $0 |
| 2016 | $1,448 | $93,969 | $0 | $0 |
| 2015 | $1,479 | $95,771 | $0 | $0 |
| 2014 | $1,886 | $128,308 | $0 | $0 |
Source: Public Records
Map
Nearby Homes
- 417 Pine St
- 231 S 4th Ave
- 216 S Second Ave
- 218 S 2nd Ave
- 503 Cedar St
- 503 Cedar St Unit 203
- 724 Pine St
- 401 S 1st Ave
- 215 N Forest Ave
- 706 Main St
- 402 Sandpoint Ave #122
- 402 Sandpoint Ave Unit 122
- 412 Sandpoint Ave Unit 334/335
- 412 Sandpoint Ave Unit 133
- 412 Sandpoint Ave Unit 332
- 412 Sandpoint Ave
- 412 Sandpoint Ave Unit 131
- 301 Iberian Way Unit 223
- 436 S Lavina Ave
- 917 Cedar St
Your Personal Tour Guide
Ask me questions while you tour the home.