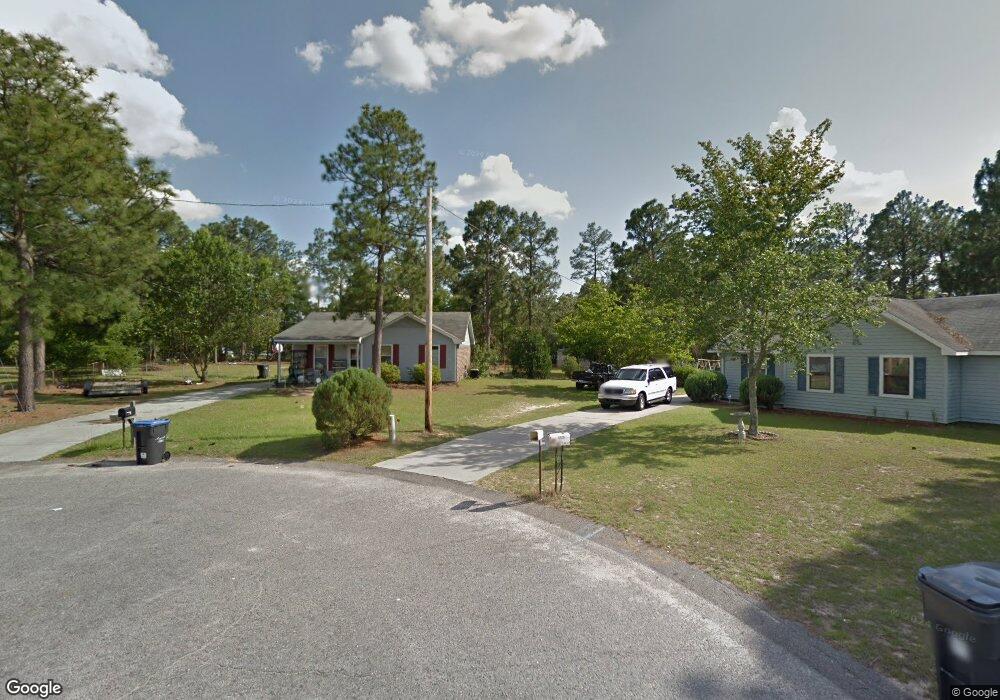
4112 Short Leaf Ct Augusta, GA 30906
Richmond Factory NeighborhoodEstimated Value: $118,000 - $140,577
About This Home
This home is located at 4112 Short Leaf Ct, Augusta, GA 30906 and is currently estimated at $132,894, approximately $130 per square foot. 4112 Short Leaf Ct is a home located in Richmond County with nearby schools including Diamond Lakes Elementary School, Pine Hill Middle School, and Johnson Magnet.
Ownership History
We collect this data history from publicly available records. To have your information removed, we recommend requesting removal directly through your county’s website.
Purchase Details
Purchase Details
Purchase Details
Purchase Details
Purchase Details
Purchase Details
Purchase Details
Purchase Details
Purchase Details
Home Values in the Area
Average Home Value in this Area
Purchase History
We collect this data history from publicly available records. To have your information removed, we recommend requesting removal directly through your county’s website.
| Date | Buyer | Sale Price | Title Company |
|---|---|---|---|
| $49,000 | -- | ||
| -- | -- | ||
| -- | -- | ||
| -- | -- | ||
| -- | -- | ||
| $44,000 | -- | ||
| -- | -- | ||
| -- | -- | ||
| -- | -- | ||
| -- | -- | ||
| $37,400 | -- |
Tax History
We collect this data history from publicly available records. To have your information removed, we recommend requesting removal directly through your county’s website.
| Year | Tax Paid | Tax Assessment Tax Assessment Total Assessment is a certain percentage of the fair market value that is determined by local assessors to be the total taxable value of land and additions on the property. | Land | Improvement |
|---|---|---|---|---|
| 2025 | $1,780 | $48,748 | $5,800 | $42,948 |
| 2024 | $1,780 | $44,700 | $5,800 | $38,900 |
| 2023 | $1,599 | $43,172 | $5,800 | $37,372 |
| 2022 | $989 | $21,178 | $5,800 | $15,378 |
| 2021 | $1,068 | $21,880 | $5,800 | $16,080 |
| 2020 | $1,055 | $21,880 | $5,800 | $16,080 |
| 2019 | $1,030 | $21,880 | $5,800 | $16,080 |
| 2018 | $1,109 | $21,880 | $5,800 | $16,080 |
| 2017 | $1,050 | $21,880 | $5,800 | $16,080 |
| 2016 | $1,051 | $21,880 | $5,800 | $16,080 |
| 2015 | $1,057 | $21,880 | $5,800 | $16,080 |
| 2014 | $1,052 | $21,712 | $5,800 | $15,912 |
Map
- 4109 Mack Ln
- 2219 Travis Rd
- 3346 Thames Place
- 2224 Moncrieff St
- 2235A Moncrieff St
- 4349 White Pine Ct
- 2432 Tobacco Rd
- 2351 Travis Pines Dr
- 2342 Travis Pines Dr
- 4211 Stone Rd
- 2114 Boykin Rd
- 2444 Tobacco Rd
- 2454 Tobacco Rd
- 4707 Grebe Ct
- 2344 Travis Rd
- 2413 Faith Trail
- 3758 Bansbury Place
- 3434 Thames Place
- 2264 Basswood Dr
- 3720 Kingsgate Dr
- 4113 Mack Ln
- 4115 Mack Ln
- 4117 Mack Ln
- 4110 Short Leaf Ct
- 4111 Mack Ln
- 4109 Short Leaf Ct
- 4108 Short Leaf Ct
- 4118 Daisy Ln
- 4124 Daisy Ln
- 4107 Short Leaf Ct
- 4110 White Pine Ct
- 4120 Daisy Ln
- 4107 Mack Ln
- 4106 Short Leaf Ct
- 4126 Daisy Ln
- 4105 Short Leaf Ct
- 4108 White Pine Ct
- 4105 Mack Ln
- 4112 White Pine Ct
- 4106 White Pine Ct
Ask me questions while you tour the home.