412 5th St Phoenix, OR 97535
Phoenix AreaEstimated Value: $268,137 - $345,000
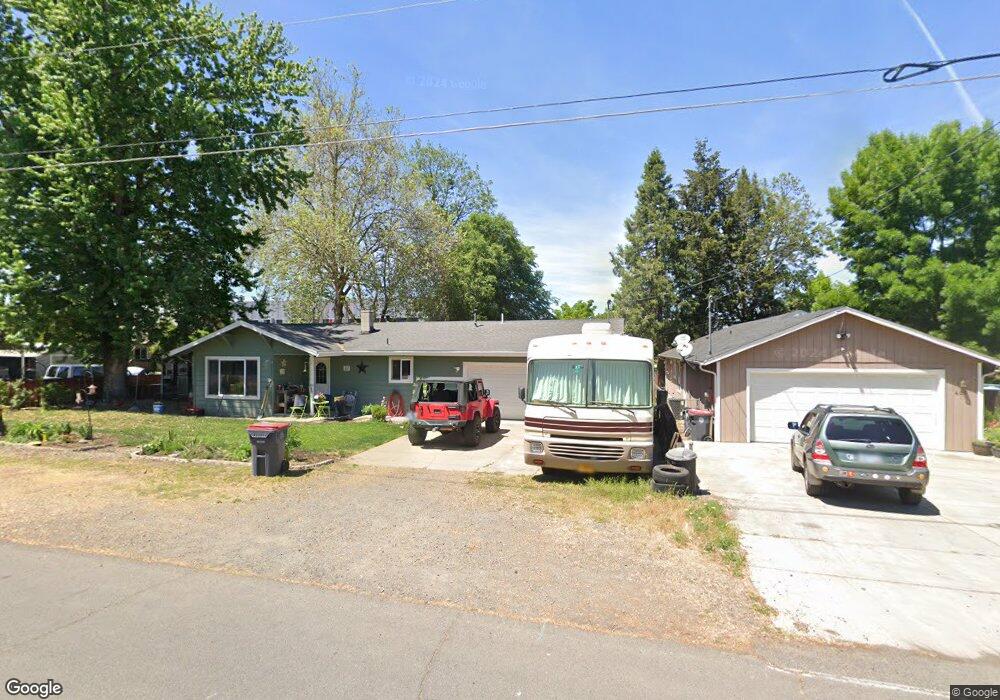
About This Home
This home is located at 412 5th St, Phoenix, OR 97535 and is currently estimated at $315,534, approximately $384 per square foot. 412 5th St is a home with nearby schools including Phoenix Elementary School, Talent Middle School, and Phoenix High School.
Ownership History
We collect this data history from publicly available records. To have your information removed, we recommend requesting removal directly through your county’s website.
Purchase Details
Purchase Details
Home Financials for this Owner
Home Financials are based on the most recent Mortgage that was taken out on this home.Home Values in the Area
Average Home Value in this Area
Purchase History
We collect this data history from publicly available records. To have your information removed, we recommend requesting removal directly through your county’s website.
| Date | Buyer | Sale Price | Title Company |
|---|---|---|---|
| -- | None Available | ||
| $60,000 | Crater Title Insurance |
Mortgage History
We collect this data history from publicly available records. To have your information removed, we recommend requesting removal directly through your county’s website.
| Date | Status | Borrower | Loan Amount |
|---|---|---|---|
| Closed | $32,388 |
Tax History
We collect this data history from publicly available records. To have your information removed, we recommend requesting removal directly through your county’s website.
| Year | Tax Paid | Tax Assessment Tax Assessment Total Assessment is a certain percentage of the fair market value that is determined by local assessors to be the total taxable value of land and additions on the property. | Land | Improvement |
|---|---|---|---|---|
| 2026 | $2,342 | $146,830 | ||
| 2025 | $2,286 | $142,560 | $67,640 | $74,920 |
| 2024 | $2,286 | $138,410 | $65,670 | $72,740 |
| 2023 | $2,214 | $134,380 | $63,760 | $70,620 |
| 2022 | $2,156 | $134,380 | $63,760 | $70,620 |
| 2021 | $2,104 | $130,470 | $61,900 | $68,570 |
| 2020 | $2,038 | $126,670 | $60,090 | $66,580 |
| 2019 | $1,984 | $119,410 | $56,630 | $62,780 |
| 2018 | $1,926 | $115,940 | $54,980 | $60,960 |
| 2017 | $1,819 | $115,940 | $54,980 | $60,960 |
| 2016 | $1,770 | $109,300 | $51,820 | $57,480 |
| 2015 | $1,701 | $109,300 | $45,120 | $64,180 |
| 2014 | $1,637 | $103,030 | $42,540 | $60,490 |
Map
- 241 W Bolz Rd
- 231 W Bolz Rd
- 211 W Bolz Rd
- 215 S C St
- 600 N Main St
- 209 Coral Cir
- 612 N Main St
- 610 N Main St Unit 5A
- 610 N Main St Unit 4D
- 225 Cheryl Ln
- 105 Maple St
- 921 N Rose St Unit A
- 130 Sharon Dr
- 221 Dano Dr
- 1004 Arana Dr
- 300 Luman Rd Unit 181
- 300 Luman Rd Unit 197
- 300 Luman Rd Unit 177
- 300 Luman Rd Unit 146
- 300 Luman Rd Unit 178
Ask me questions while you tour the home.