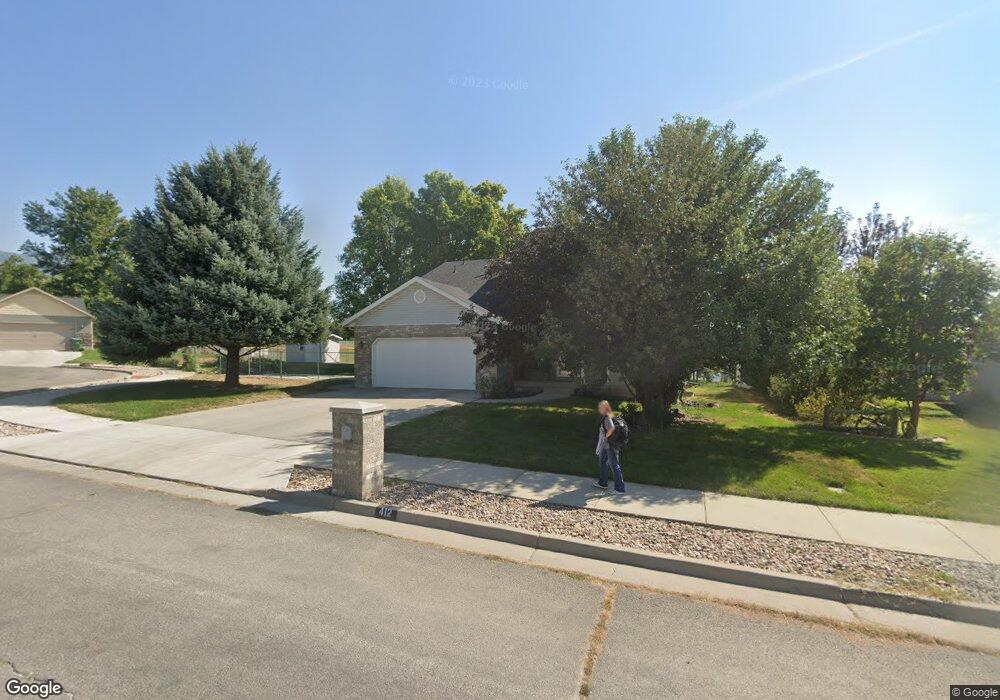
412 E 400 S Smithfield, UT 84335
Estimated Value: $482,000 - $658,000
5
Beds
4
Baths
3,240
Sq Ft
$170/Sq Ft
Est. Value
About This Home
This home is located at 412 E 400 S, Smithfield, UT 84335 and is currently estimated at $552,385, approximately $170 per square foot. 412 E 400 S is a home located in Cache County with nearby schools including Sunrise School, Cedar Ridge School, and North Cache Middle School.
Ownership History
Date
Name
Owned For
Owner Type
Purchase Details
Closed on
Jul 12, 2006
Sold by
Oliverson Tyler N
Bought by
Dubose Grayson P and Dubose Lenonnie A
Current Estimated Value
Home Financials for this Owner
Home Financials are based on the most recent Mortgage that was taken out on this home.
Original Mortgage
$120,000
Outstanding Balance
$70,905
Interest Rate
6.66%
Mortgage Type
New Conventional
Estimated Equity
$481,480
Purchase Details
Closed on
Feb 7, 2006
Sold by
Gwynn Dan and Gwynn Brenda
Bought by
Oliverson Tyler N
Purchase Details
Closed on
Dec 21, 2005
Sold by
Gwynn Dan and Gwynn Brenda
Bought by
Morgan Stanley Dean Witter Capital I Inc
Create a Home Valuation Report for This Property
The Home Valuation Report is an in-depth analysis detailing your home's value as well as a comparison with similar homes in the area
Home Values in the Area
Average Home Value in this Area
Purchase History
| Date | Buyer | Sale Price | Title Company |
|---|---|---|---|
| Dubose Grayson P | -- | American Secure Title | |
| Oliverson Tyler N | $191,000 | None Available | |
| Morgan Stanley Dean Witter Capital I Inc | -- | Backman Title Services |
Source: Public Records
Mortgage History
| Date | Status | Borrower | Loan Amount |
|---|---|---|---|
| Open | Dubose Grayson P | $120,000 |
Source: Public Records
Tax History
| Year | Tax Paid | Tax Assessment Tax Assessment Total Assessment is a certain percentage of the fair market value that is determined by local assessors to be the total taxable value of land and additions on the property. | Land | Improvement |
|---|---|---|---|---|
| 2025 | $2,186 | $292,590 | $0 | $0 |
| 2024 | $2,049 | $257,255 | $0 | $0 |
| 2023 | $2,141 | $254,270 | $0 | $0 |
| 2022 | $2,176 | $254,270 | $0 | $0 |
| 2021 | $2,150 | $383,845 | $70,000 | $313,845 |
| 2020 | $1,902 | $316,801 | $70,000 | $246,801 |
| 2019 | $1,879 | $298,301 | $51,500 | $246,801 |
| 2018 | $1,733 | $266,110 | $51,500 | $214,610 |
| 2017 | $1,617 | $135,630 | $0 | $0 |
| 2016 | $1,646 | $135,630 | $0 | $0 |
| 2015 | $1,344 | $110,325 | $0 | $0 |
| 2014 | $1,316 | $110,215 | $0 | $0 |
| 2013 | -- | $110,215 | $0 | $0 |
Source: Public Records
Map
Nearby Homes
Your Personal Tour Guide
Ask me questions while you tour the home.