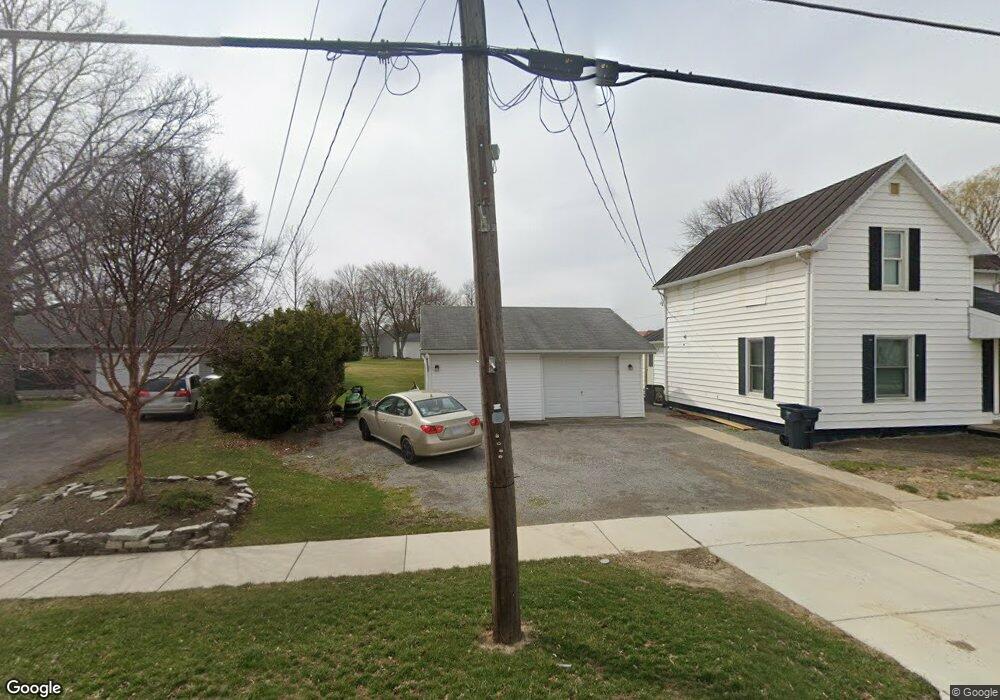
412 E Sycamore St Columbus Grove, OH 45830
Estimated Value: $133,000 - $223,000
3
Beds
1
Bath
1,616
Sq Ft
$102/Sq Ft
Est. Value
About This Home
This home is located at 412 E Sycamore St, Columbus Grove, OH 45830 and is currently estimated at $165,305, approximately $102 per square foot. 412 E Sycamore St is a home located in Putnam County with nearby schools including Columbus Grove Elementary School, Columbus Grove Middle School, and Columbus Grove High School.
Ownership History
Date
Name
Owned For
Owner Type
Purchase Details
Closed on
Aug 17, 2016
Sold by
Clymer Beverly K and Clymer Gary
Bought by
Banal Jay V and Banal Amy S
Current Estimated Value
Home Financials for this Owner
Home Financials are based on the most recent Mortgage that was taken out on this home.
Original Mortgage
$33,000
Outstanding Balance
$14,291
Interest Rate
3.42%
Mortgage Type
Future Advance Clause Open End Mortgage
Estimated Equity
$151,014
Purchase Details
Closed on
Jul 18, 2013
Sold by
Clymer Beverly K and Clymer Gary
Bought by
Banal Jay Vance
Create a Home Valuation Report for This Property
The Home Valuation Report is an in-depth analysis detailing your home's value as well as a comparison with similar homes in the area
Purchase History
| Date | Buyer | Sale Price | Title Company |
|---|---|---|---|
| Banal Jay V | -- | None Available | |
| Banal Jay Vance | $80,000 | None Available |
Source: Public Records
Mortgage History
| Date | Status | Borrower | Loan Amount |
|---|---|---|---|
| Open | Banal Jay V | $33,000 | |
| Closed | Banal Jay Vance | $0 |
Source: Public Records
Tax History
| Year | Tax Paid | Tax Assessment Tax Assessment Total Assessment is a certain percentage of the fair market value that is determined by local assessors to be the total taxable value of land and additions on the property. | Land | Improvement |
|---|---|---|---|---|
| 2025 | $1,001 | $28,930 | $5,410 | $23,520 |
| 2024 | $988 | $28,930 | $5,410 | $23,520 |
| 2023 | $1,010 | $25,210 | $4,210 | $21,000 |
| 2022 | $1,028 | $25,211 | $4,211 | $21,000 |
| 2021 | $999 | $25,210 | $4,210 | $21,000 |
| 2020 | $1,020 | $19,490 | $3,770 | $15,720 |
| 2019 | $822 | $21,850 | $4,210 | $17,640 |
| 2018 | $813 | $21,850 | $4,210 | $17,640 |
| 2017 | $827 | $21,850 | $4,210 | $17,640 |
| 2016 | $735 | $19,490 | $3,770 | $15,720 |
| 2015 | $738 | $19,490 | $3,770 | $15,720 |
| 2014 | $746 | $19,490 | $3,770 | $15,720 |
| 2013 | -- | $0 | $0 | $0 |
Source: Public Records
Map
Nearby Homes
Your Personal Tour Guide
Ask me questions while you tour the home.