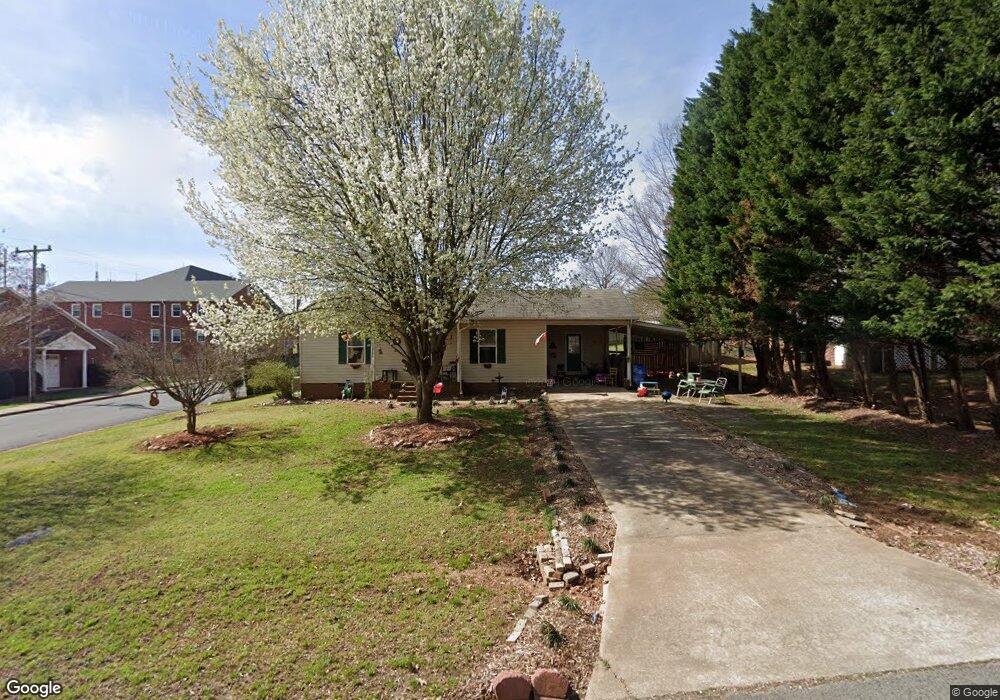
412 John St China Grove, NC 28023
Estimated Value: $189,019 - $227,000
2
Beds
2
Baths
864
Sq Ft
$244/Sq Ft
Est. Value
About This Home
This home is located at 412 John St, China Grove, NC 28023 and is currently estimated at $210,755, approximately $243 per square foot. 412 John St is a home located in Rowan County with nearby schools including China Grove Elementary School, China Grove Middle School, and South Rowan High School.
Ownership History
Date
Name
Owned For
Owner Type
Purchase Details
Closed on
Sep 27, 2017
Sold by
Thomas Arthur Vance and Thomas Georgianna W
Bought by
Clayvan Llc
Current Estimated Value
Purchase Details
Closed on
Aug 22, 2012
Sold by
Us Bank Trust Na
Bought by
Thomas Arthur Vance
Purchase Details
Closed on
Jun 19, 2012
Sold by
Livengood Lori Ann and Livengood Jeffrey
Bought by
Vericrest Opportunity Loan Trust 2011 Np
Purchase Details
Closed on
May 25, 2011
Sold by
Livengood Jeffrey Carr
Bought by
Livengood Lori Miller
Create a Home Valuation Report for This Property
The Home Valuation Report is an in-depth analysis detailing your home's value as well as a comparison with similar homes in the area
Home Values in the Area
Average Home Value in this Area
Purchase History
| Date | Buyer | Sale Price | Title Company |
|---|---|---|---|
| Clayvan Llc | -- | None Available | |
| Thomas Arthur Vance | $35,500 | None Available | |
| Us Bank Trust Na | -- | None Available | |
| Vericrest Opportunity Loan Trust 2011 Np | $51,867 | None Available | |
| Livengood Lori Miller | -- | None Available |
Source: Public Records
Tax History
| Year | Tax Paid | Tax Assessment Tax Assessment Total Assessment is a certain percentage of the fair market value that is determined by local assessors to be the total taxable value of land and additions on the property. | Land | Improvement |
|---|---|---|---|---|
| 2025 | $1,351 | $125,047 | $27,825 | $97,222 |
| 2024 | $1,351 | $125,047 | $27,825 | $97,222 |
| 2023 | $1,351 | $125,047 | $27,825 | $97,222 |
| 2022 | $1,118 | $91,807 | $23,100 | $68,707 |
| 2021 | $1,099 | $91,807 | $23,100 | $68,707 |
| 2020 | $1,099 | $91,807 | $23,100 | $68,707 |
| 2019 | $1,099 | $91,807 | $23,100 | $68,707 |
| 2018 | $978 | $79,883 | $23,100 | $56,783 |
| 2017 | $978 | $79,883 | $23,100 | $56,783 |
| 2016 | $978 | $79,883 | $23,100 | $56,783 |
| 2015 | $993 | $79,883 | $23,100 | $56,783 |
| 2014 | $988 | $81,657 | $23,100 | $58,557 |
Source: Public Records
Map
Nearby Homes
- 300 Chinaberry Dr
- 409 Chinaberry Dr
- 305 Keller St
- 407 Blackwelder St
- 2189 Mary St
- 402 S Bostian St
- 504 S Franklin St
- 403 Stevens St
- 1095 Roberts St
- 648 E Ketchie St
- 0 N Chapel St
- 654 Bostian Rd
- 568 & 570 Kirk St
- 1015 Cherry Bark Place
- 2282 Stephens Farm Dr
- 2264 Stephens Farm Dr
- 2258 Stephens Farm Dr
- 36 Elizabeth St
- 145 Dillon St
- 619 U S 29
Your Personal Tour Guide
Ask me questions while you tour the home.