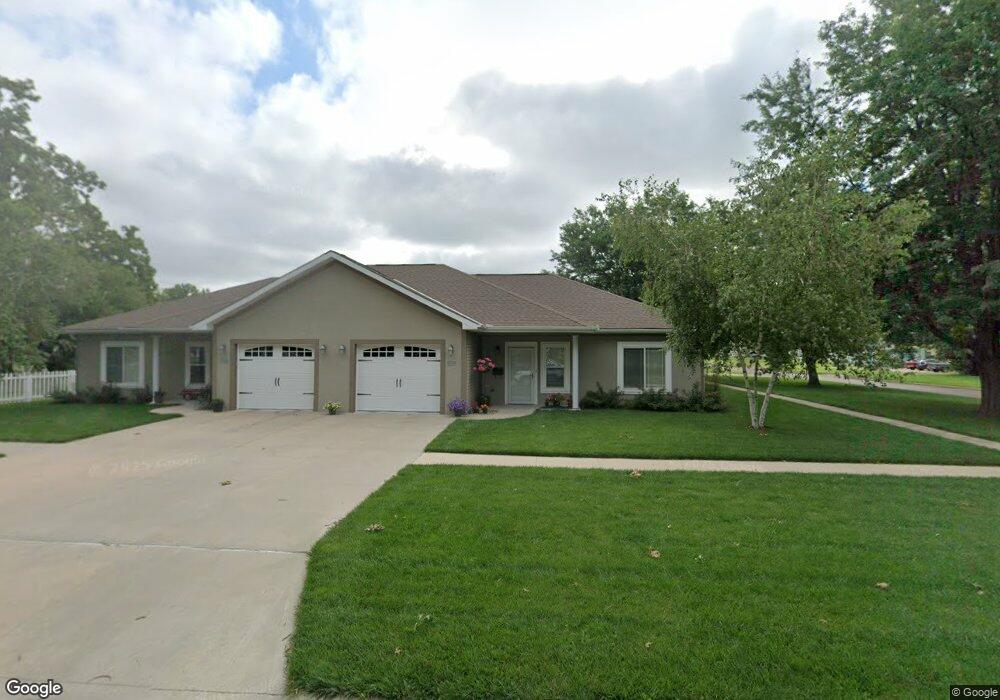
412 N 10th St David City, NE 68632
Estimated Value: $195,000 - $363,000
Studio
2
Baths
2,392
Sq Ft
$112/Sq Ft
Est. Value
About This Home
This home is located at 412 N 10th St, David City, NE 68632 and is currently estimated at $268,508, approximately $112 per square foot. 412 N 10th St is a home with nearby schools including David City Secondary School, St. Mary's School, and Aquinas High School.
Ownership History
Date
Name
Owned For
Owner Type
Purchase Details
Closed on
Sep 19, 2012
Sold by
Pinnacle Bank
Bought by
Wright Roberg G and Wright Wunetta
Current Estimated Value
Home Financials for this Owner
Home Financials are based on the most recent Mortgage that was taken out on this home.
Original Mortgage
$0
Interest Rate
3.59%
Mortgage Type
Commercial
Purchase Details
Closed on
Sep 17, 2012
Sold by
Colfax Cty Title
Bought by
Wright Robert G
Home Financials for this Owner
Home Financials are based on the most recent Mortgage that was taken out on this home.
Original Mortgage
$0
Interest Rate
3.59%
Mortgage Type
Commercial
Create a Home Valuation Report for This Property
The Home Valuation Report is an in-depth analysis detailing your home's value as well as a comparison with similar homes in the area
Home Values in the Area
Average Home Value in this Area
Purchase History
We collect this data history from publicly available records. To have your information removed, we recommend requesting removal directly through your county’s website.
| Date | Buyer | Sale Price | Title Company |
|---|---|---|---|
| Wright Roberg G | $160,000 | -- | |
| Wright Robert G | -- | -- |
Source: Public Records
Mortgage History
We collect this data history from publicly available records. To have your information removed, we recommend requesting removal directly through your county’s website.
| Date | Status | Borrower | Loan Amount |
|---|---|---|---|
| Closed | Wright Robert G | $0 |
Source: Public Records
Tax History
| Year | Tax Paid | Tax Assessment Tax Assessment Total Assessment is a certain percentage of the fair market value that is determined by local assessors to be the total taxable value of land and additions on the property. | Land | Improvement |
|---|---|---|---|---|
| 2025 | $2,595 | $240,305 | $15,300 | $225,005 |
| 2024 | $2,778 | $231,305 | $15,300 | $216,005 |
| 2023 | $3,188 | $213,305 | $15,300 | $198,005 |
| 2022 | $3,421 | $222,470 | $23,800 | $198,670 |
| 2021 | $3,215 | $208,800 | $14,000 | $194,800 |
| 2020 | $3,134 | $199,975 | $14,000 | $185,975 |
| 2019 | $3,052 | $195,395 | $12,600 | $182,795 |
| 2018 | $2,706 | $176,005 | $12,600 | $163,405 |
| 2017 | $2,702 | $176,005 | $12,600 | $163,405 |
| 2016 | $2,652 | $176,005 | $12,600 | $163,405 |
| 2015 | $2,833 | $176,005 | $12,600 | $163,405 |
| 2014 | $2,713 | $162,760 | $12,600 | $150,160 |
Source: Public Records
Map
Nearby Homes
Your Personal Tour Guide
Ask me questions while you tour the home.