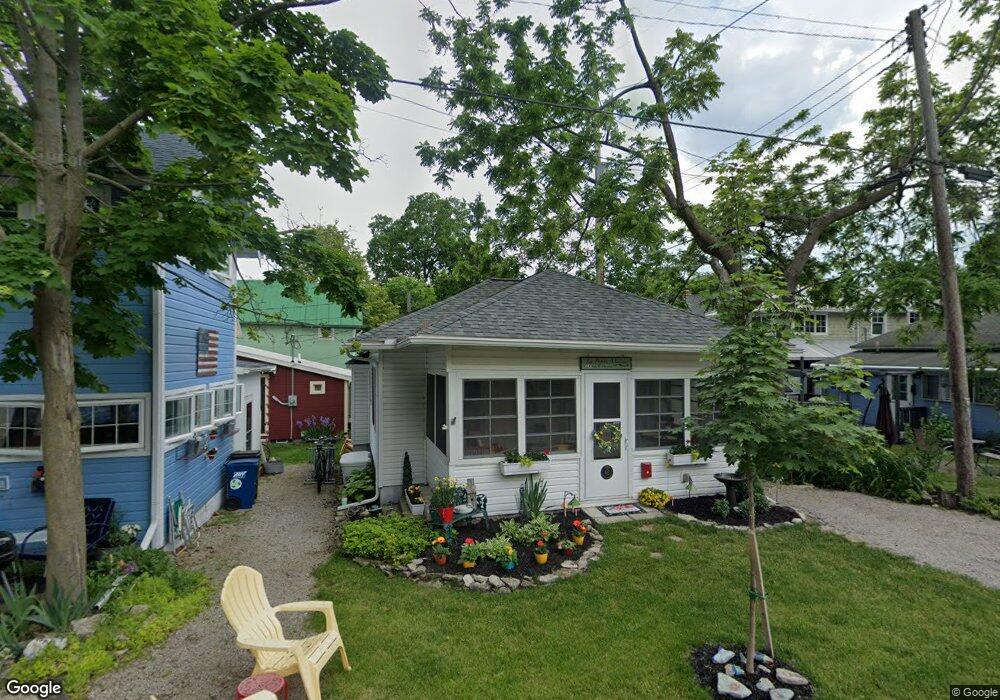
413 E 2nd St Lakeside Marblehead, OH 43440
Estimated Value: $300,572 - $403,000
2
Beds
1
Bath
488
Sq Ft
$726/Sq Ft
Est. Value
About This Home
This home is located at 413 E 2nd St, Lakeside Marblehead, OH 43440 and is currently estimated at $354,143, approximately $725 per square foot. 413 E 2nd St is a home located in Ottawa County with nearby schools including Danbury Middle School and Danbury High School.
Ownership History
Date
Name
Owned For
Owner Type
Purchase Details
Closed on
Apr 28, 2022
Sold by
Thomas Linville William
Bought by
Honaker David Benjamin
Current Estimated Value
Purchase Details
Closed on
Apr 26, 2022
Sold by
Flasche Lee H and Flasche Suzanne J
Bought by
Lee H And Suzanne J Flasche Trust
Purchase Details
Closed on
Apr 1, 2014
Sold by
Flasche Lee H and Flasche Susanne J
Bought by
Flasche Lee H and Revoca Suzanne J Flasche
Purchase Details
Closed on
Oct 29, 2010
Sold by
Benson Ann C
Bought by
Flasche Lee H and Flasche Suzanne J
Create a Home Valuation Report for This Property
The Home Valuation Report is an in-depth analysis detailing your home's value as well as a comparison with similar homes in the area
Home Values in the Area
Average Home Value in this Area
Purchase History
| Date | Buyer | Sale Price | Title Company |
|---|---|---|---|
| Honaker David Benjamin | -- | Linville William Thomas | |
| Lee H And Suzanne J Flasche Trust | -- | James G Flaherty Lpa | |
| Flasche Lee H | -- | James G Flaherty Co Lpa | |
| Flasche Lee H | -- | None Available | |
| Flasche Lee H | $130,000 | Attorney |
Source: Public Records
Tax History
| Year | Tax Paid | Tax Assessment Tax Assessment Total Assessment is a certain percentage of the fair market value that is determined by local assessors to be the total taxable value of land and additions on the property. | Land | Improvement |
|---|---|---|---|---|
| 2024 | $2,792 | $81,571 | $56,308 | $25,263 |
| 2023 | $2,780 | $73,889 | $56,312 | $17,577 |
| 2022 | $2,551 | $73,889 | $56,312 | $17,577 |
| 2021 | $2,559 | $73,890 | $56,310 | $17,580 |
| 2020 | $2,072 | $56,620 | $40,220 | $16,400 |
| 2019 | $1,917 | $56,620 | $40,220 | $16,400 |
| 2018 | $1,915 | $56,620 | $40,220 | $16,400 |
| 2017 | $1,789 | $52,370 | $40,220 | $12,150 |
| 2016 | $1,771 | $52,370 | $40,220 | $12,150 |
| 2015 | $1,777 | $52,370 | $40,220 | $12,150 |
| 2014 | $1,755 | $50,540 | $40,220 | $10,320 |
| 2013 | $1,629 | $50,540 | $40,220 | $10,320 |
Source: Public Records
Map
Nearby Homes
- 336 Peach Ave
- 170 Jasmine Ave
- 324 Plum Ave
- 162 Walnut Ave Unit 2
- 317 Maple Ave Unit 17
- 212 E 7th St
- 721 Laurel Ave
- 317 Oak Ave
- 224 Oak Ave
- 715 Cherry Ave
- 723 Oak Ave
- 727 Oak Ave
- 1209 Prairie St
- 541 Oak Ave
- 502 Stone St
- 5486 E Harbor Rd
- 608 N Monument View
- 280 N Lighthouse Oval
- 401 N Rockport Dr
- 340 Lighthouse Oval
Your Personal Tour Guide
Ask me questions while you tour the home.