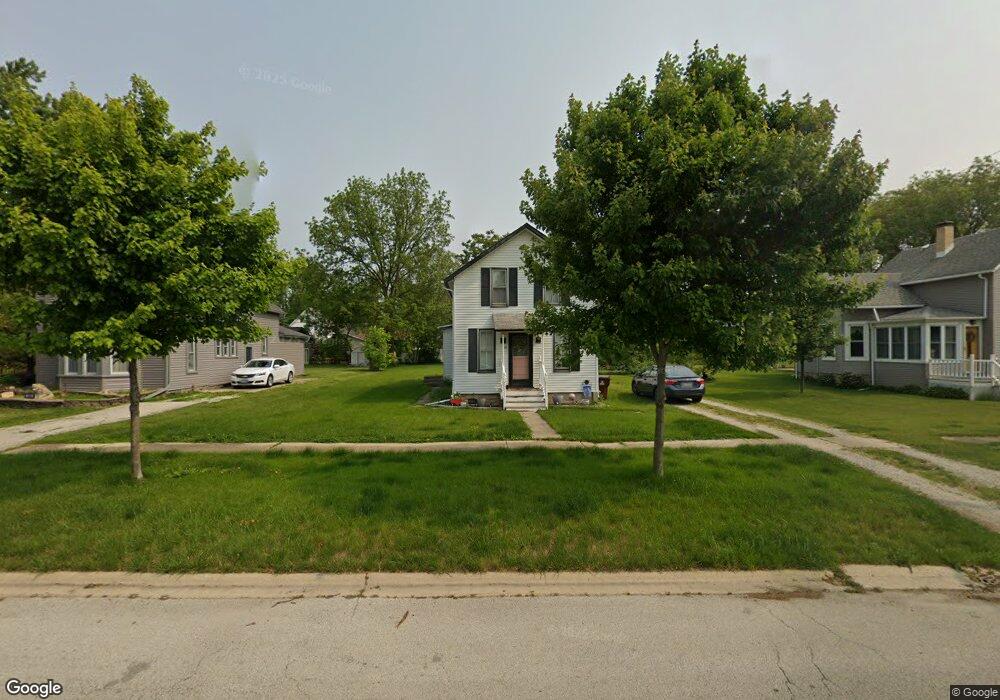
413 E Main St Peotone, IL 60468
Estimated Value: $129,000 - $227,399
2
Beds
1
Bath
1,400
Sq Ft
$142/Sq Ft
Est. Value
About This Home
This home is located at 413 E Main St, Peotone, IL 60468 and is currently estimated at $199,350, approximately $142 per square foot. 413 E Main St is a home located in Will County with nearby schools including Peotone Elementary School, Peotone Intermediate Center, and Peotone Junior High School.
Ownership History
Date
Name
Owned For
Owner Type
Purchase Details
Closed on
Feb 28, 2024
Sold by
A-Z Home Services Inc
Bought by
Lister Megan H
Current Estimated Value
Home Financials for this Owner
Home Financials are based on the most recent Mortgage that was taken out on this home.
Original Mortgage
$116,400
Outstanding Balance
$114,221
Interest Rate
7.13%
Mortgage Type
New Conventional
Estimated Equity
$85,129
Purchase Details
Closed on
Jan 20, 2024
Sold by
Nave David M
Bought by
A-Z Home Services Inc
Home Financials for this Owner
Home Financials are based on the most recent Mortgage that was taken out on this home.
Original Mortgage
$116,400
Outstanding Balance
$114,221
Interest Rate
7.13%
Mortgage Type
New Conventional
Estimated Equity
$85,129
Purchase Details
Closed on
Aug 19, 1997
Sold by
Thompson Linda and Nave Linda
Bought by
Nave David M
Home Financials for this Owner
Home Financials are based on the most recent Mortgage that was taken out on this home.
Original Mortgage
$63,000
Interest Rate
9.55%
Create a Home Valuation Report for This Property
The Home Valuation Report is an in-depth analysis detailing your home's value as well as a comparison with similar homes in the area
Home Values in the Area
Average Home Value in this Area
Purchase History
| Date | Buyer | Sale Price | Title Company |
|---|---|---|---|
| Lister Megan H | $120,000 | Citywide Title | |
| A-Z Home Services Inc | $85,000 | Citywide Title | |
| Nave David M | -- | Chicago Title Insurance Co |
Source: Public Records
Mortgage History
| Date | Status | Borrower | Loan Amount |
|---|---|---|---|
| Open | Lister Megan H | $116,400 | |
| Previous Owner | Nave David M | $63,000 |
Source: Public Records
Tax History
| Year | Tax Paid | Tax Assessment Tax Assessment Total Assessment is a certain percentage of the fair market value that is determined by local assessors to be the total taxable value of land and additions on the property. | Land | Improvement |
|---|---|---|---|---|
| 2024 | $3,071 | $50,148 | $14,146 | $36,002 |
| 2023 | $3,071 | $46,090 | $12,832 | $33,258 |
| 2022 | $2,995 | $41,579 | $11,576 | $30,003 |
| 2021 | $1,435 | $38,425 | $10,698 | $27,727 |
| 2020 | $1,473 | $36,491 | $10,160 | $26,331 |
| 2019 | $1,539 | $36,491 | $10,160 | $26,331 |
| 2018 | $1,645 | $36,491 | $10,160 | $26,331 |
| 2017 | $1,656 | $35,532 | $9,893 | $25,639 |
| 2016 | $1,667 | $34,835 | $9,699 | $25,136 |
| 2015 | $2,505 | $33,689 | $9,380 | $24,309 |
| 2014 | $2,505 | $34,969 | $9,380 | $25,589 |
| 2013 | $2,505 | $35,219 | $9,447 | $25,772 |
Source: Public Records
Map
Nearby Homes
- 409 E Main St
- 313 E Corning Ave
- 311 S Third St
- 205 W Crawford St
- 0 S Governors Hwy
- 114 Hickory St
- 320 W North St
- 332 W North St
- 206 Hickory St
- 536 Schroeder Ave
- 617 The Hague
- Lot 015 S Rathje Rd
- 452 Manor Dr
- 0 W Wilmington Rd
- 820 W Locust Ln
- 0 S Ridgeland Unit 21819390
- 28200 S Lagrange Hwy
- Sec.32 W T 33n R 13e Rd
- 1059 Hummingbird Ln
- Lot 002 Oriole Dr
Your Personal Tour Guide
Ask me questions while you tour the home.