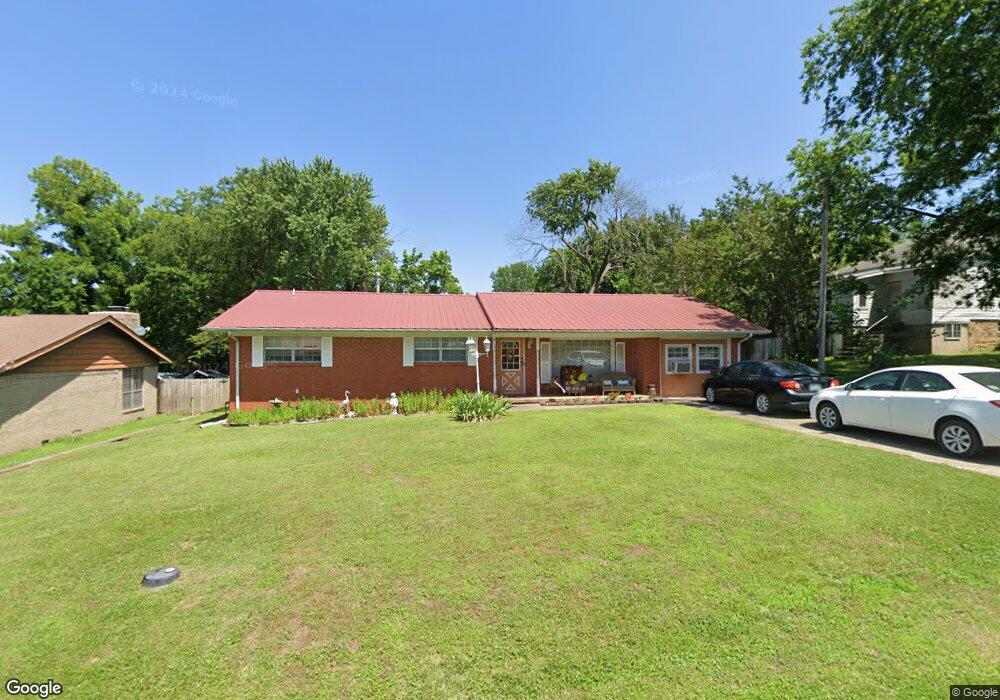
413 S 3rd St Eufaula, OK 74432
Estimated Value: $169,527 - $221,000
3
Beds
2
Baths
1,647
Sq Ft
$122/Sq Ft
Est. Value
About This Home
This home is located at 413 S 3rd St, Eufaula, OK 74432 and is currently estimated at $200,382, approximately $121 per square foot. 413 S 3rd St is a home located in McIntosh County with nearby schools including Eufaula Elementary School, Eufaula Middle School, and Eufaula High School.
Ownership History
Date
Name
Owned For
Owner Type
Purchase Details
Closed on
Mar 12, 2006
Sold by
Vaughn Allen B and Vaughn Shelly L
Bought by
Mayle Stacey J and Mayle Frederick
Current Estimated Value
Home Financials for this Owner
Home Financials are based on the most recent Mortgage that was taken out on this home.
Original Mortgage
$75,363
Interest Rate
6.5%
Mortgage Type
FHA
Purchase Details
Closed on
Aug 16, 1996
Sold by
Dobbs
Bought by
Vaughn
Create a Home Valuation Report for This Property
The Home Valuation Report is an in-depth analysis detailing your home's value as well as a comparison with similar homes in the area
Home Values in the Area
Average Home Value in this Area
Purchase History
| Date | Buyer | Sale Price | Title Company |
|---|---|---|---|
| Mayle Stacey J | $76,000 | None Available | |
| Vaughn | $56,500 | -- |
Source: Public Records
Mortgage History
| Date | Status | Borrower | Loan Amount |
|---|---|---|---|
| Previous Owner | Mayle Stacey J | $75,363 |
Source: Public Records
Tax History
| Year | Tax Paid | Tax Assessment Tax Assessment Total Assessment is a certain percentage of the fair market value that is determined by local assessors to be the total taxable value of land and additions on the property. | Land | Improvement |
|---|---|---|---|---|
| 2025 | $991 | $12,327 | $846 | $11,481 |
| 2024 | $958 | $12,327 | $825 | $11,502 |
| 2023 | $958 | $11,619 | $818 | $10,801 |
| 2022 | $853 | $11,281 | $812 | $10,469 |
| 2021 | $835 | $11,281 | $812 | $10,469 |
| 2020 | $809 | $10,953 | $812 | $10,141 |
| 2019 | $790 | $10,634 | $812 | $9,822 |
| 2018 | $751 | $10,325 | $812 | $9,513 |
| 2017 | $727 | $9,731 | $812 | $8,919 |
| 2016 | $707 | $9,448 | $812 | $8,636 |
| 2015 | $675 | $9,173 | $812 | $8,361 |
| 2014 | $649 | $8,906 | $812 | $8,094 |
Source: Public Records
Map
Nearby Homes
- 411 S 3rd St
- 401 High St
- 213 S 4th St
- 504 Woodland St
- 366 S Main St Unit 23
- 403 W Grand Ave
- 309 W Foley St
- 58 Boardwalk
- 509 Sunset Strip
- 87 Rose Way
- 115311 S 4237
- 0 Eufaula Sportsman St Unit 26
- 206 Forest
- 111 N 5th St
- 607 Sunset Strip Ave
- 800 W Grand Ave
- 5 Rose Way
- TBD Selmon Rd
- 109 S E St
- TBD Selmon Border Rd
Your Personal Tour Guide
Ask me questions while you tour the home.