413 Spring St Long Branch, NJ 07740
Estimated Value: $487,000 - $611,540
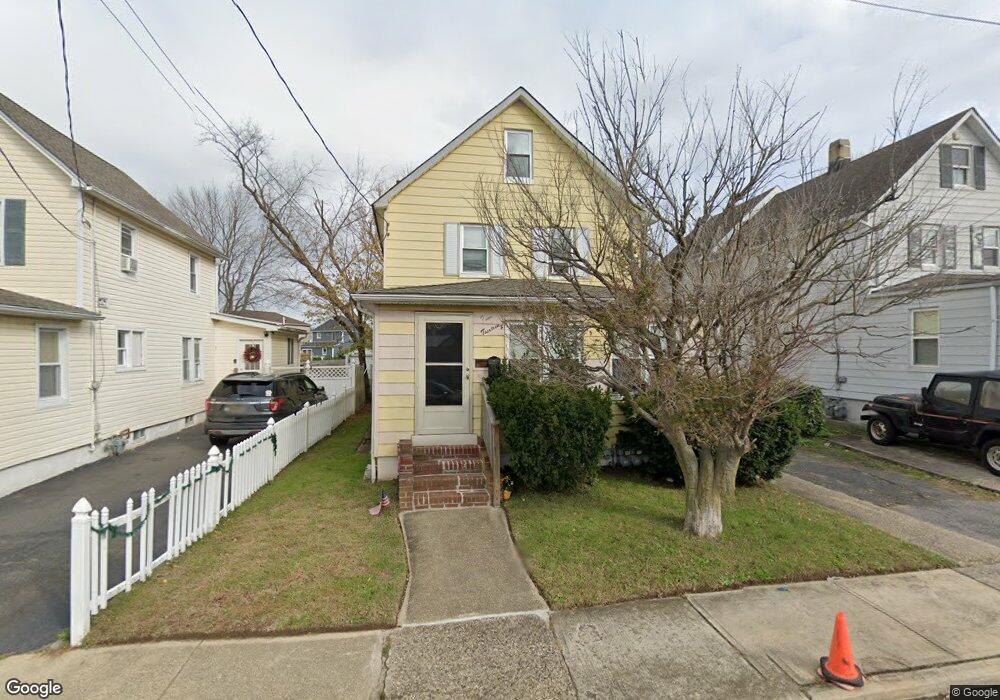
About This Home
This home is located at 413 Spring St, Long Branch, NJ 07740 and is currently estimated at $547,635, approximately $303 per square foot. 413 Spring St is a home located in Monmouth County with nearby schools including Long Branch High School, Holy Trinity School, and Bet Yaakov of the Jersey Shore.
Ownership History
We collect this data history from publicly available records. To have your information removed, we recommend requesting removal directly through your county’s website.
Purchase Details
Home Financials for this Owner
Home Financials are based on the most recent Mortgage that was taken out on this home.Purchase Details
Home Values in the Area
Average Home Value in this Area
Purchase History
We collect this data history from publicly available records. To have your information removed, we recommend requesting removal directly through your county’s website.
| Date | Buyer | Sale Price | Title Company |
|---|---|---|---|
| $320,000 | Nuco Title | ||
| $320,000 | Nuco Title | ||
| -- | Simplicity Title | ||
| -- | Simplicity Title |
Mortgage History
We collect this data history from publicly available records. To have your information removed, we recommend requesting removal directly through your county’s website.
| Date | Status | Borrower | Loan Amount |
|---|---|---|---|
| Open | $304,000 | ||
| Closed | $304,000 |
Tax History
We collect this data history from publicly available records. To have your information removed, we recommend requesting removal directly through your county’s website.
| Year | Tax Paid | Tax Assessment Tax Assessment Total Assessment is a certain percentage of the fair market value that is determined by local assessors to be the total taxable value of land and additions on the property. | Land | Improvement |
|---|---|---|---|---|
| 2025 | $8,435 | $593,600 | $253,300 | $340,300 |
| 2024 | $5,358 | $548,800 | $223,300 | $325,500 |
| 2023 | $5,358 | $345,000 | $173,300 | $171,700 |
| 2022 | $4,139 | $280,900 | $116,100 | $164,800 |
| 2021 | $4,139 | $250,200 | $96,100 | $154,100 |
| 2020 | $4,980 | $238,300 | $85,100 | $153,200 |
| 2019 | $4,881 | $232,200 | $86,100 | $146,100 |
| 2018 | $4,862 | $230,000 | $86,100 | $143,900 |
| 2017 | $4,685 | $227,300 | $86,100 | $141,200 |
| 2016 | $4,620 | $228,600 | $91,100 | $137,500 |
| 2015 | $5,158 | $231,600 | $93,000 | $138,600 |
| 2014 | $4,811 | $227,700 | $104,700 | $123,000 |
Map
- 428 Bath Ave
- 485 Broadway
- 22 Washington St
- 430 Broadway
- 539 Summer St
- 556 Summer St
- 395 Broadway
- 288 Morris Ave
- 392 Hampton Ave Unit Front
- 192 Hillside Ave
- 282 Morris Ave
- 158 Norwood Ave
- 17 Howland Place
- 615 Overton Place
- 641 Campbell Ave
- 478 Rickey Ln
- 476 Rickey Ln
- 364 Westwood Ave Unit 76
- 364 Westwood Ave Unit 78
- 364 Westwood Ave Unit 16
- 51 Morrell St
- 47 Morrell St
- 417 Spring St
- 41 Morrell St
- 411 Spring St
- 414 Exchange Place
- 37 Morrell St
- 420 Exchange Place
- 416 Spring St
- 54 Morrell St
- 58 Morrell St
- 407 Spring St
- 418 Exchange Place
- 63 Morrell St
- 412 Exchange Place
- 50 Morrell St
- 46 Morrell St
- 33 Morrell St
- 422 Exchange Place
- 36 Morrell St
Ask me questions while you tour the home.