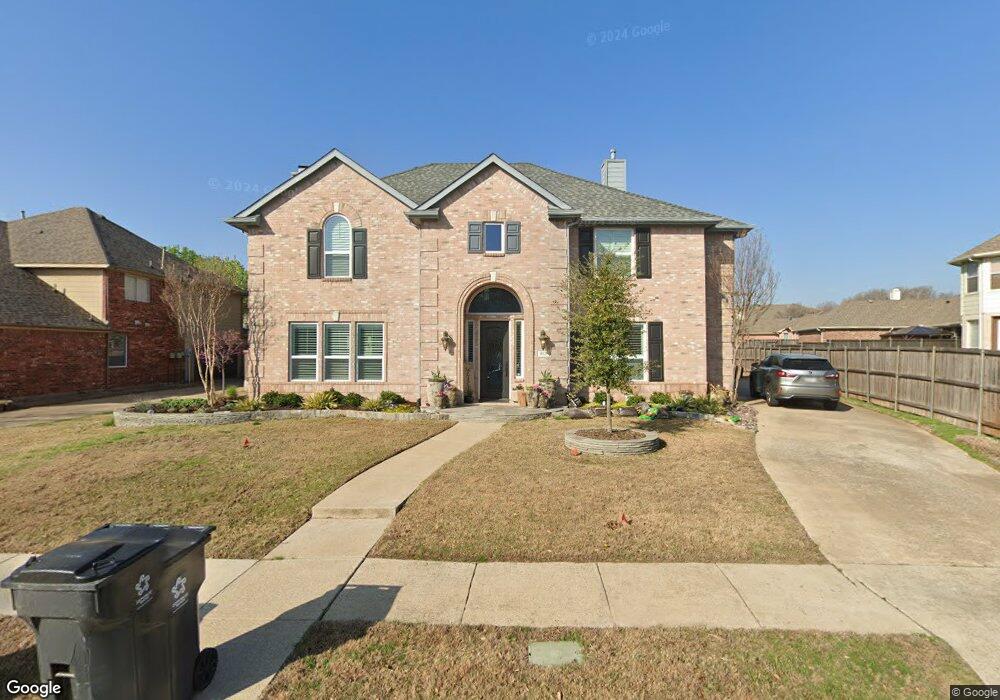
413 Sumac Ct Murphy, TX 75094
Wylie AreaEstimated Value: $558,000 - $629,120
About This Home
This home is located at 413 Sumac Ct, Murphy, TX 75094 and is currently estimated at $590,280, approximately $165 per square foot. 413 Sumac Ct is a home located in Collin County with nearby schools including Miller Elementary School, Murphy Middle School, and C A Mcmillen High School.
Ownership History
We collect this data history from publicly available records. To have your information removed, we recommend requesting removal directly through your county’s website.
Purchase Details
Purchase Details
Home Financials for this Owner
Home Financials are based on the most recent Mortgage that was taken out on this home.Home Values in the Area
Average Home Value in this Area
Purchase History
We collect this data history from publicly available records. To have your information removed, we recommend requesting removal directly through your county’s website.
| Date | Buyer | Sale Price | Title Company |
|---|---|---|---|
| -- | None Available | ||
| -- | -- |
Mortgage History
We collect this data history from publicly available records. To have your information removed, we recommend requesting removal directly through your county’s website.
| Date | Status | Borrower | Loan Amount |
|---|---|---|---|
| Open | $211,000 | ||
| Closed | $153,500 | ||
| Closed | $24,700 | ||
| Closed | $161,699 |
Tax History
We collect this data history from publicly available records. To have your information removed, we recommend requesting removal directly through your county’s website.
| Year | Tax Paid | Tax Assessment Tax Assessment Total Assessment is a certain percentage of the fair market value that is determined by local assessors to be the total taxable value of land and additions on the property. | Land | Improvement |
|---|---|---|---|---|
| 2025 | $8,430 | $616,502 | $126,500 | $503,646 |
| 2024 | $7,972 | $560,456 | $126,500 | $514,379 |
| 2023 | $7,972 | $509,505 | $126,500 | $455,977 |
| 2022 | $9,071 | $463,186 | $110,000 | $406,683 |
| 2021 | $8,696 | $421,078 | $88,000 | $333,078 |
| 2020 | $8,878 | $425,067 | $77,000 | $348,067 |
| 2019 | $9,268 | $423,000 | $77,000 | $346,000 |
| 2018 | $9,434 | $426,659 | $77,000 | $355,254 |
| 2017 | $8,576 | $388,299 | $77,000 | $311,299 |
| 2016 | $7,894 | $382,106 | $66,000 | $316,106 |
| 2015 | $6,495 | $330,269 | $49,500 | $280,769 |
| 2014 | $6,495 | $291,414 | $0 | $0 |
Map
- 408 Willow Bend Dr
- 202 Sweetgum Dr
- 206 Sweetgum Dr
- 524 Jasmine Dr
- 324 Shady Timbers Ln
- 5707 Manchester Dr
- 129 Timberbluff Ln
- 300 Shady Timbers Ln
- 3608 Edmonton Ct
- 428 Hickory Dr
- 5729 New Castle Dr
- 5724 New Castle Dr
- 5705 Abingdon Dr
- 200 Sunny Crest Dr
- 3415 Norwood Cir
- 701 Summer Place
- 5417 Harbour Rd
- 5604 Exeter Dr
- 505 Cedar Elm Cir
- 517 Cedar Elm Cir
- 422 Maple Sugar Dr
- 426 Maple Sugar Dr
- 418 Maple Sugar Dr
- 417 Sumac Ct
- 421 Sumac Ct
- 430 Maple Sugar Dr
- 420 Walnut Dr
- 426 Walnut Dr
- 122 Post Crest Dr
- 126 Post Crest Dr
- 425 Sumac Ct
- 416 Walnut Dr
- 433 Maple Sugar Dr
- 130 Post Crest Dr
- 118 Post Crest Dr
- 434 Maple Sugar Dr
- 430 Walnut Dr
- 429 Sumac Ct
- 416 Sumac Ct
- 420 Sumac Ct
Ask me questions while you tour the home.