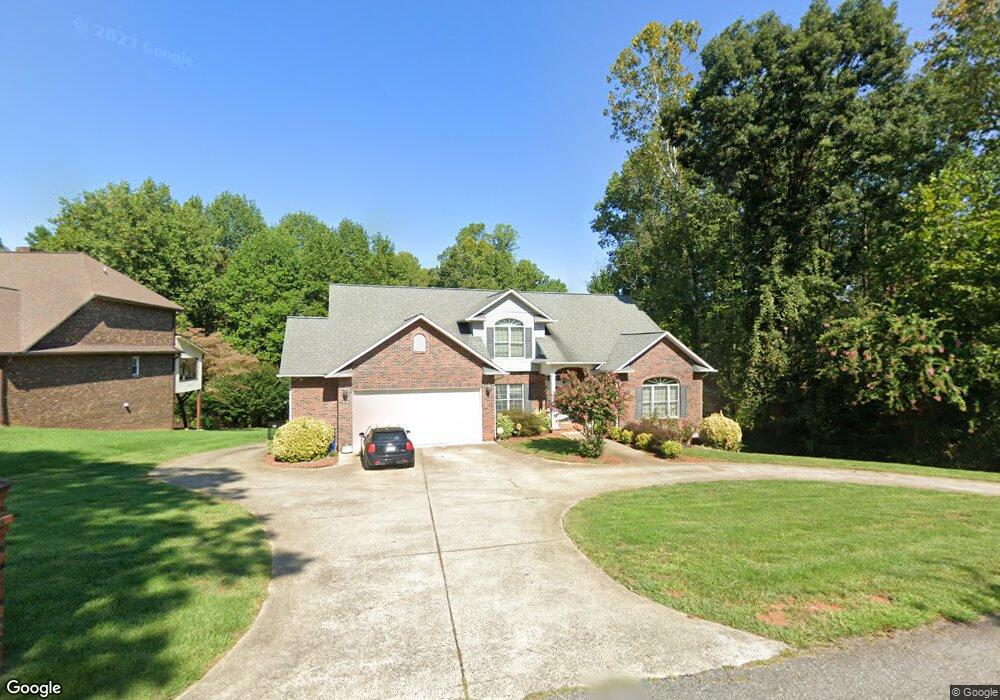
415 4th Ave NE Conover, NC 28613
Estimated Value: $617,302 - $694,000
5
Beds
5
Baths
4,236
Sq Ft
$155/Sq Ft
Est. Value
About This Home
This home is located at 415 4th Ave NE, Conover, NC 28613 and is currently estimated at $654,576, approximately $154 per square foot. 415 4th Ave NE is a home located in Catawba County with nearby schools including Shuford Elementary School, Newton-Conover Middle School, and Newton-Conover High School.
Ownership History
Date
Name
Owned For
Owner Type
Purchase Details
Closed on
Sep 9, 2020
Sold by
Bennett Boderick M and Bennett Tasheenia
Bought by
Crider Henry Francis and Crider Eileen Marie
Current Estimated Value
Home Financials for this Owner
Home Financials are based on the most recent Mortgage that was taken out on this home.
Original Mortgage
$336,000
Outstanding Balance
$295,456
Interest Rate
2.9%
Mortgage Type
New Conventional
Estimated Equity
$359,120
Purchase Details
Closed on
Jan 21, 2016
Sold by
Hall Gordon and Hall Elaine
Bought by
Benneth Tasheenia M and Bennett Boderick M
Home Financials for this Owner
Home Financials are based on the most recent Mortgage that was taken out on this home.
Original Mortgage
$385,000
Interest Rate
3.98%
Mortgage Type
VA
Purchase Details
Closed on
May 1, 1997
Bought by
Hall Gordon Taylor and Hall Elaine E
Create a Home Valuation Report for This Property
The Home Valuation Report is an in-depth analysis detailing your home's value as well as a comparison with similar homes in the area
Home Values in the Area
Average Home Value in this Area
Purchase History
| Date | Buyer | Sale Price | Title Company |
|---|---|---|---|
| Crider Henry Francis | $420,000 | None Available | |
| Benneth Tasheenia M | $385,000 | Attorney | |
| Hall Gordon Taylor | $375,000 | -- | |
| Hall Gordon Taylor | $375,000 | -- |
Source: Public Records
Mortgage History
| Date | Status | Borrower | Loan Amount |
|---|---|---|---|
| Open | Crider Henry Francis | $336,000 | |
| Previous Owner | Benneth Tasheenia M | $385,000 |
Source: Public Records
Tax History
| Year | Tax Paid | Tax Assessment Tax Assessment Total Assessment is a certain percentage of the fair market value that is determined by local assessors to be the total taxable value of land and additions on the property. | Land | Improvement |
|---|---|---|---|---|
| 2025 | $4,572 | $576,200 | $30,100 | $546,100 |
| 2024 | $4,572 | $576,200 | $30,100 | $546,100 |
| 2023 | $4,572 | $576,200 | $30,100 | $546,100 |
| 2022 | $4,188 | $389,600 | $30,100 | $359,500 |
| 2021 | $4,188 | $389,600 | $30,100 | $359,500 |
| 2020 | $4,188 | $389,600 | $30,100 | $359,500 |
| 2019 | $4,188 | $389,600 | $0 | $0 |
| 2018 | $4,176 | $388,500 | $30,300 | $358,200 |
| 2017 | $4,060 | $0 | $0 | $0 |
| 2016 | $4,060 | $0 | $0 | $0 |
| 2015 | $3,686 | $388,500 | $30,300 | $358,200 |
| 2014 | $3,686 | $396,300 | $37,100 | $359,200 |
Source: Public Records
Map
Nearby Homes
- 510 4th Ave NE
- 406 5th Ave NE
- 505 2nd Street Place NE Unit D2
- 505 2nd Street Place NE Unit B2
- 611 5th Ave NE Unit PT21&22/L
- 513 2nd Avenue Place NE
- 510 7th St NE
- 710 4th Ave NE
- 306 7th Street Place NE
- 705 2nd Ave NE
- 603 1st Avenue Place NE
- 507 7th St NE Unit 29
- 203 8th St NE
- 1002 4th St NE
- 404 Thornburg Dr NE
- 406 Rock Barn Rd NE
- 905 Conover Blvd E
- 215 Towne Ct NW
- 712 2nd Ave NW
- 918 Emmanuel Church Rd
- 501 4th Ave NE
- 411 4th Ave NE
- 406 4th Ave NE
- 401 5th Street Place NE
- 503 4th Ave NE
- 502, 504, 506 4th Ave NE
- 310 5th St NE
- 502 4th Ave NE
- 305 5th St NE
- 312 5th St NE
- 302 5th Street Place NE
- 402 5th Street Place NE
- 400 5th St NE
- 306 5th St NE
- 403 5th St NE
- 405 5th Street Place NE
- 402 5th St NE
- 501 5th Ave NE
- 506 4th Ave NE
- 404 5th Street Place NE
Your Personal Tour Guide
Ask me questions while you tour the home.