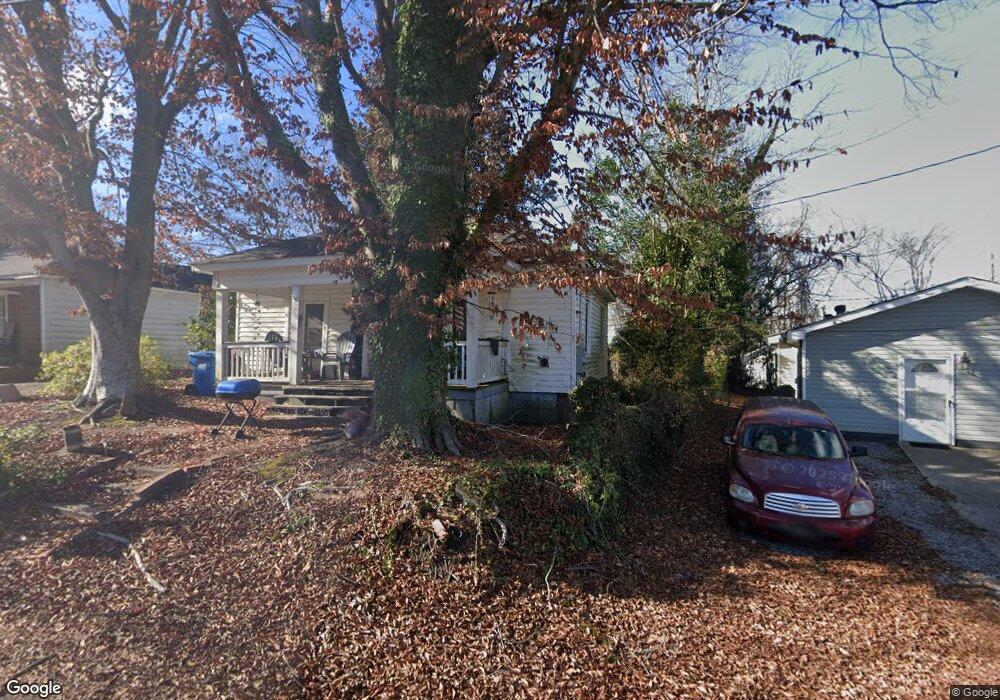
415 Garner St Buford, GA 30518
Estimated Value: $183,000 - $336,000
2
Beds
1
Bath
750
Sq Ft
$315/Sq Ft
Est. Value
About This Home
This home is located at 415 Garner St, Buford, GA 30518 and is currently estimated at $235,898, approximately $314 per square foot. 415 Garner St is a home located in Gwinnett County with nearby schools including Buford Elementary School, Buford Senior Academy, and Buford Academy.
Ownership History
Date
Name
Owned For
Owner Type
Purchase Details
Closed on
Mar 31, 2016
Sold by
Whitehead Mary
Bought by
Sycamore Ventures Llc
Current Estimated Value
Purchase Details
Closed on
Sep 22, 2006
Sold by
Banks Charles
Bought by
Whitehead Mary
Home Financials for this Owner
Home Financials are based on the most recent Mortgage that was taken out on this home.
Original Mortgage
$70,200
Interest Rate
6.36%
Mortgage Type
New Conventional
Create a Home Valuation Report for This Property
The Home Valuation Report is an in-depth analysis detailing your home's value as well as a comparison with similar homes in the area
Home Values in the Area
Average Home Value in this Area
Purchase History
| Date | Buyer | Sale Price | Title Company |
|---|---|---|---|
| Sycamore Ventures Llc | $74,000 | -- | |
| Whitehead Mary | $78,000 | -- |
Source: Public Records
Mortgage History
| Date | Status | Borrower | Loan Amount |
|---|---|---|---|
| Previous Owner | Whitehead Mary | $70,200 |
Source: Public Records
Tax History
| Year | Tax Paid | Tax Assessment Tax Assessment Total Assessment is a certain percentage of the fair market value that is determined by local assessors to be the total taxable value of land and additions on the property. | Land | Improvement |
|---|---|---|---|---|
| 2025 | $903 | $62,960 | $40,000 | $22,960 |
| 2024 | $831 | $57,880 | $33,600 | $24,280 |
| 2023 | $831 | $44,920 | $26,000 | $18,920 |
| 2022 | $645 | $44,920 | $26,000 | $18,920 |
| 2021 | $398 | $27,760 | $16,800 | $10,960 |
| 2020 | $398 | $27,760 | $16,800 | $10,960 |
| 2019 | $360 | $27,760 | $16,800 | $10,960 |
| 2018 | $331 | $25,560 | $8,800 | $16,760 |
| 2016 | $229 | $17,840 | $5,600 | $12,240 |
| 2015 | $237 | $17,840 | $5,600 | $12,240 |
| 2014 | $228 | $16,880 | $5,600 | $11,280 |
Source: Public Records
Map
Nearby Homes
- 490 Jackson St
- 1769 Rowland Pass
- 577 Garner St
- 151 N Church St
- 619 Garner St
- 260 Wilbanks St
- 120 Poplar St
- 110 Poplar St
- 59 Spring St
- 225 Smokey Rd
- 425 Church St
- 235 Poplar St
- 294 Watson St
- 120 N Gwinnett St
- 108 Woodland St
- 25 Sudderth St
- 550 Gwinnett St
- 585 Briard Dr
- 395 Pine L Dr
- 243 N Gwinnett St
Your Personal Tour Guide
Ask me questions while you tour the home.