415 Locust St Newburgh, IN 47630
Estimated Value: $167,000 - $207,000
About This Home
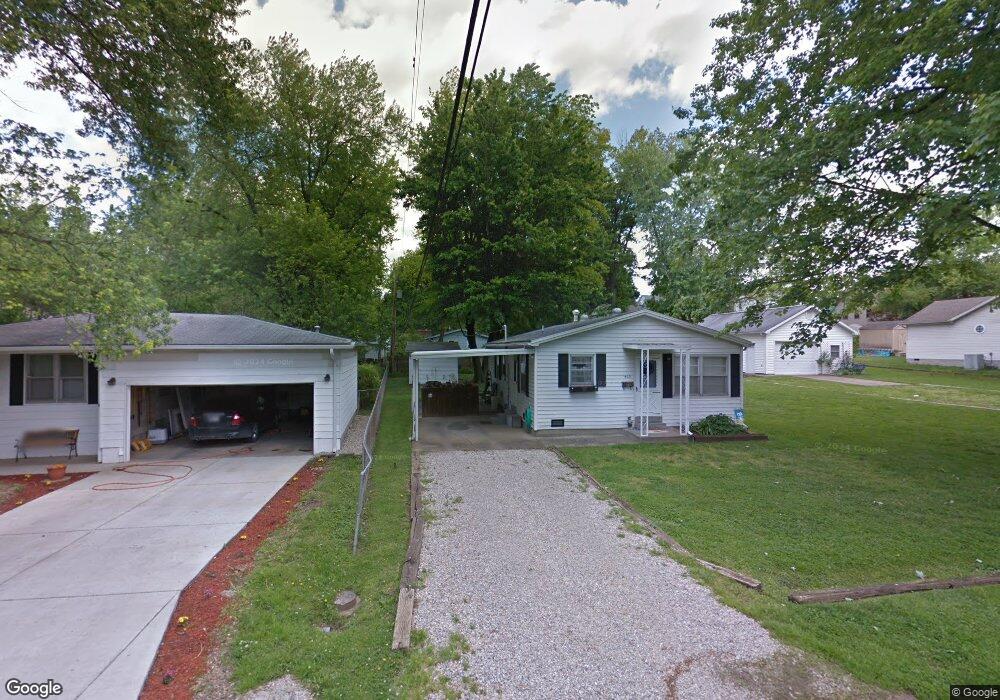
This home is located at 415 Locust St, Newburgh, IN 47630 and is currently estimated at $182,575, approximately $150 per square foot. 415 Locust St is a home located in Warrick County with nearby schools including Newburgh Elementary School, Castle North Middle School, and Castle High School.
Ownership History
We collect this data history from publicly available records. To have your information removed, we recommend requesting removal directly through your county’s website.
Purchase Details
Home Financials for this Owner
Home Financials are based on the most recent Mortgage that was taken out on this home.Purchase Details
Home Values in the Area
Average Home Value in this Area
Purchase History
We collect this data history from publicly available records. To have your information removed, we recommend requesting removal directly through your county’s website.
| Date | Buyer | Sale Price | Title Company |
|---|---|---|---|
| -- | Statewide Title Company Inc | ||
| $35,085 | None Available |
Mortgage History
We collect this data history from publicly available records. To have your information removed, we recommend requesting removal directly through your county’s website.
| Date | Status | Borrower | Loan Amount |
|---|---|---|---|
| Closed | $45,000 |
Tax History
We collect this data history from publicly available records. To have your information removed, we recommend requesting removal directly through your county’s website.
| Year | Tax Paid | Tax Assessment Tax Assessment Total Assessment is a certain percentage of the fair market value that is determined by local assessors to be the total taxable value of land and additions on the property. | Land | Improvement |
|---|---|---|---|---|
| 2025 | $1,815 | $101,300 | $37,300 | $64,000 |
| 2024 | $1,950 | $96,900 | $37,300 | $59,600 |
| 2023 | $1,820 | $95,100 | $37,300 | $57,800 |
| 2022 | $1,255 | $65,400 | $15,700 | $49,700 |
| 2021 | $1,046 | $52,300 | $12,300 | $40,000 |
| 2020 | $1,006 | $50,300 | $12,300 | $38,000 |
| 2019 | $976 | $48,800 | $12,300 | $36,500 |
| 2018 | $1,050 | $52,500 | $12,300 | $40,200 |
| 2017 | $1,035 | $51,700 | $12,300 | $39,400 |
| 2016 | $969 | $48,400 | $10,700 | $37,700 |
| 2014 | $970 | $48,500 | $10,600 | $37,900 |
| 2013 | $1,029 | $52,600 | $10,600 | $42,000 |
Map
- 8 E Gray St
- 714 Cypress St
- 318 E Main St
- 322 Shady Ln
- 305 E Jennings St
- 0 W Jennings St
- 101 E Jennings St Unit E
- 110 Monroe St
- 406 Polk St
- 5666 N Cypress St
- 706 Rose Dr
- 715 Carole Place
- 5466 W Sherwood Dr
- 624 Forest Park Dr
- 5233 State Route 261
- 8033 Marywood Dr
- 1 Hillside Trail
- 5670 Hillside Trail
- 5200 Kenwood Dr
- 6211 Pfafflin Lake Blvd
Ask me questions while you tour the home.