Estimated Value: $737,000
--
Bed
3
Baths
2,129
Sq Ft
$346/Sq Ft
Est. Value
About This Home
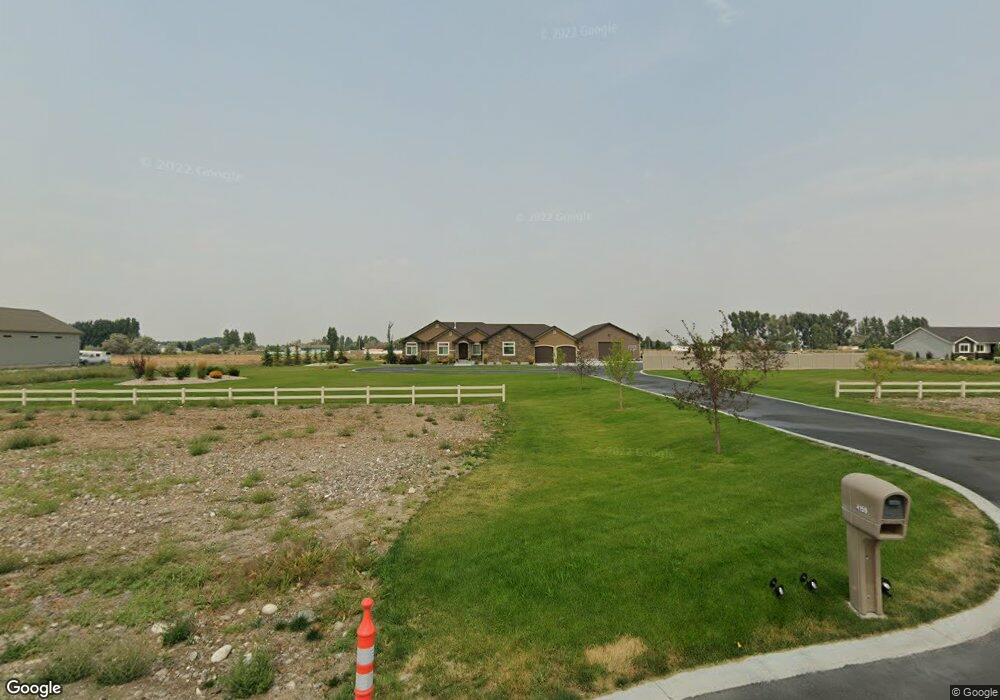
This home is located at 4159 E 176 N, Rigby, ID 83442 and is currently estimated at $737,000, approximately $346 per square foot. 4159 E 176 N is a home with nearby schools including South Fork Elementary School, Rigby Middle School, and Rigby High School.
Ownership History
Date
Name
Owned For
Owner Type
Purchase Details
Closed on
Sep 1, 2020
Sold by
Olsen Rick and Olsen Heidi
Bought by
Olsen Rick Barry and Olsen Heidi Lynn
Current Estimated Value
Home Financials for this Owner
Home Financials are based on the most recent Mortgage that was taken out on this home.
Original Mortgage
$389,000
Outstanding Balance
$308,262
Interest Rate
3%
Mortgage Type
New Conventional
Estimated Equity
$428,738
Purchase Details
Closed on
Mar 27, 2018
Sold by
Marrow Express Llc
Bought by
Olsen Rick and Olsen Heidi
Home Financials for this Owner
Home Financials are based on the most recent Mortgage that was taken out on this home.
Original Mortgage
$382,000
Interest Rate
4.38%
Mortgage Type
Unknown
Purchase Details
Closed on
Sep 26, 2016
Sold by
Shipton J Scott and Shipton Jennifer
Bought by
Olsen Rick and Olsen Heidi
Home Financials for this Owner
Home Financials are based on the most recent Mortgage that was taken out on this home.
Original Mortgage
$45,200
Interest Rate
3.8%
Mortgage Type
Adjustable Rate Mortgage/ARM
Create a Home Valuation Report for This Property
The Home Valuation Report is an in-depth analysis detailing your home's value as well as a comparison with similar homes in the area
Home Values in the Area
Average Home Value in this Area
Purchase History
| Date | Buyer | Sale Price | Title Company |
|---|---|---|---|
| Olsen Rick Barry | -- | First American Title Rigby | |
| Olsen Rick | -- | First American Title Rigby | |
| Olsen Rick | -- | Amerititle Idaho Falls |
Source: Public Records
Mortgage History
| Date | Status | Borrower | Loan Amount |
|---|---|---|---|
| Open | Olsen Rick Barry | $389,000 | |
| Closed | Olsen Rick | $382,000 | |
| Previous Owner | Olsen Rick | $45,200 |
Source: Public Records
Tax History
| Year | Tax Paid | Tax Assessment Tax Assessment Total Assessment is a certain percentage of the fair market value that is determined by local assessors to be the total taxable value of land and additions on the property. | Land | Improvement |
|---|---|---|---|---|
| 2025 | $1,799 | $778,279 | $0 | $0 |
| 2024 | $1,799 | $759,701 | $0 | $0 |
| 2023 | $2,749 | $784,744 | $0 | $0 |
| 2022 | $3,881 | $682,503 | $0 | $0 |
| 2021 | $3,689 | $523,329 | $0 | $0 |
| 2020 | $2,892 | $477,709 | $0 | $0 |
| 2019 | $3,250 | $423,355 | $0 | $0 |
| 2018 | $618 | $60,000 | $0 | $0 |
| 2017 | $534 | $50,000 | $0 | $0 |
| 2016 | $542 | $50,000 | $0 | $0 |
| 2015 | $563 | $50,000 | $0 | $0 |
| 2014 | $564 | $50,000 | $0 | $0 |
| 2013 | -- | $50,000 | $0 | $0 |
Source: Public Records
Map
Nearby Homes
Your Personal Tour Guide
Ask me questions while you tour the home.