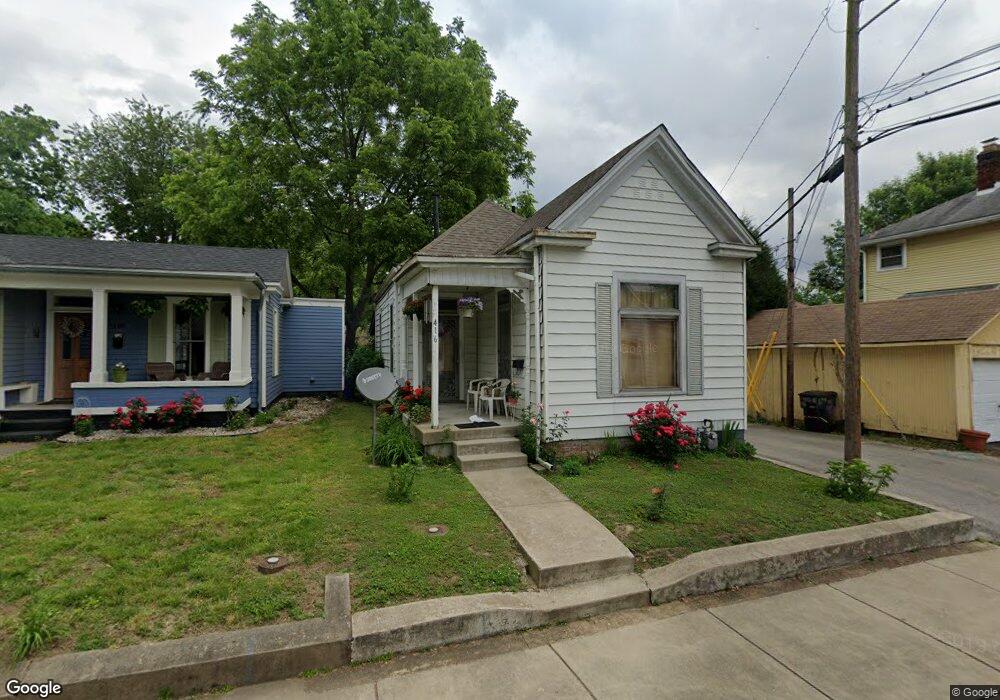
416 E 11th St New Albany, IN 47150
New Albany AreaEstimated Value: $113,000 - $187,000
About This Home
This home is located at 416 E 11th St, New Albany, IN 47150 and is currently estimated at $158,101, approximately $245 per square foot. 416 E 11th St is a home located in Floyd County with nearby schools including S. Ellen Jones Elementary School, Hazelwood Middle School, and New Albany Senior High School.
Ownership History
We collect this data history from publicly available records. To have your information removed, we recommend requesting removal directly through your county’s website.
Purchase Details
Purchase Details
Purchase Details
Home Values in the Area
Average Home Value in this Area
Purchase History
We collect this data history from publicly available records. To have your information removed, we recommend requesting removal directly through your county’s website.
| Date | Buyer | Sale Price | Title Company |
|---|---|---|---|
| -- | None Listed On Document | ||
| -- | None Listed On Document | ||
| -- | -- |
Tax History
We collect this data history from publicly available records. To have your information removed, we recommend requesting removal directly through your county’s website.
| Year | Tax Paid | Tax Assessment Tax Assessment Total Assessment is a certain percentage of the fair market value that is determined by local assessors to be the total taxable value of land and additions on the property. | Land | Improvement |
|---|---|---|---|---|
| 2025 | $1,044 | $49,500 | $5,600 | $43,900 |
| 2024 | $941 | $44,300 | $5,600 | $38,700 |
| 2023 | $790 | $37,000 | $5,600 | $31,400 |
| 2022 | $816 | $38,200 | $5,600 | $32,600 |
| 2021 | $717 | $33,300 | $5,600 | $27,700 |
| 2020 | $692 | $32,100 | $5,600 | $26,500 |
| 2019 | $654 | $30,300 | $5,600 | $24,700 |
| 2018 | $614 | $28,300 | $5,600 | $22,700 |
| 2017 | $627 | $28,400 | $5,600 | $22,800 |
| 2016 | $562 | $28,100 | $5,600 | $22,500 |
| 2014 | $586 | $29,300 | $5,600 | $23,700 |
| 2013 | -- | $30,100 | $5,600 | $24,500 |
Map
- 1109 E Spring St
- 1105 E Spring St
- 1117 E Spring St
- 1119 E Spring St
- 410 E 11th St
- 1201 E Spring St
- 418 E 11th St
- 1116 E Elm St
- 1108 E Elm St
- 1118 E Elm St
- 1106 E Elm St
- 1017 E Spring St
- 1104 E Spring St
- 1120 E Elm St
- 411 E 11th St
- 1112 E Spring St Unit 1
- 1110 E Spring St Unit 1 & 2
- 1110 E Spring St
- 1114 E Spring St
- 1203 E Spring St
Ask me questions while you tour the home.