Estimated Value: $286,000 - $503,000
3
Beds
1
Bath
1,672
Sq Ft
$221/Sq Ft
Est. Value
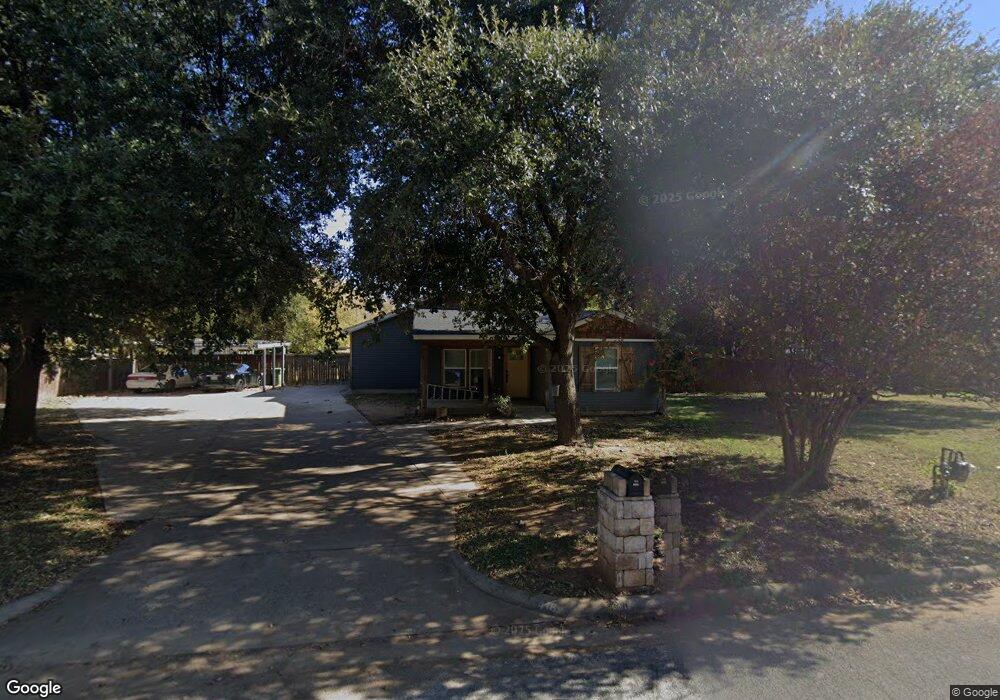
About This Home
This home is located at 416 Harmon Rd, Hurst, TX 76053 and is currently estimated at $370,017, approximately $221 per square foot. 416 Harmon Rd is a home located in Tarrant County with nearby schools including West Hurst Elementary School, Hurst J High School, and L.D. Bell High School.
Ownership History
Date
Name
Owned For
Owner Type
Purchase Details
Closed on
May 18, 1995
Sold by
Campbell Gerald F and Campbell Patsy R
Bought by
Russell Paul W and Michele Russell K
Current Estimated Value
Home Financials for this Owner
Home Financials are based on the most recent Mortgage that was taken out on this home.
Original Mortgage
$40,000
Interest Rate
8.36%
Mortgage Type
Seller Take Back
Create a Home Valuation Report for This Property
The Home Valuation Report is an in-depth analysis detailing your home's value as well as a comparison with similar homes in the area
Home Values in the Area
Average Home Value in this Area
Purchase History
We collect this data history from publicly available records. To have your information removed, we recommend requesting removal directly through your county’s website.
| Date | Buyer | Sale Price | Title Company |
|---|---|---|---|
| Russell Paul W | -- | American Title |
Source: Public Records
Mortgage History
We collect this data history from publicly available records. To have your information removed, we recommend requesting removal directly through your county’s website.
| Date | Status | Borrower | Loan Amount |
|---|---|---|---|
| Closed | Russell Paul W | $40,000 |
Source: Public Records
Tax History
| Year | Tax Paid | Tax Assessment Tax Assessment Total Assessment is a certain percentage of the fair market value that is determined by local assessors to be the total taxable value of land and additions on the property. | Land | Improvement |
|---|---|---|---|---|
| 2025 | $1,351 | $204,162 | -- | -- |
| 2024 | $2,411 | $404,358 | $84,856 | $319,502 |
| 2023 | $3,380 | $374,058 | $99,830 | $274,228 |
| 2022 | $3,532 | $271,378 | $99,830 | $171,548 |
| 2021 | $5,651 | $234,322 | $99,830 | $134,492 |
| 2020 | $4,832 | $200,834 | $99,830 | $101,004 |
| 2019 | $1,873 | $76,524 | $35,000 | $41,524 |
| 2018 | $1,396 | $57,031 | $19,000 | $38,031 |
| 2017 | $1,453 | $57,419 | $19,000 | $38,419 |
| 2016 | $1,421 | $56,149 | $19,000 | $37,149 |
| 2015 | $1,218 | $59,700 | $34,000 | $25,700 |
| 2014 | $1,218 | $59,700 | $34,000 | $25,700 |
Source: Public Records
Map
Nearby Homes
- 420 Arthur Dr
- 412 Fleming Dr
- 552 Souder Dr
- 260 Corinna Ct
- 629 Harrison Ln
- 224 Willow St
- 617 Woodside Dr
- 625 Caduceus Ln
- 632 Caduceus Ct
- 628 W Redbud Dr
- 716 Norwood Dr
- 709 Hurstview Dr
- 721 Briarwood Ln
- 416 Simmons Dr
- 727 Norwood Dr
- 212 E Ellen Ave
- 307 Terry Rd
- 153 Sheri Ln
- 758 Briarwood Ln
- 609 E Ellen Ave
Your Personal Tour Guide
Ask me questions while you tour the home.