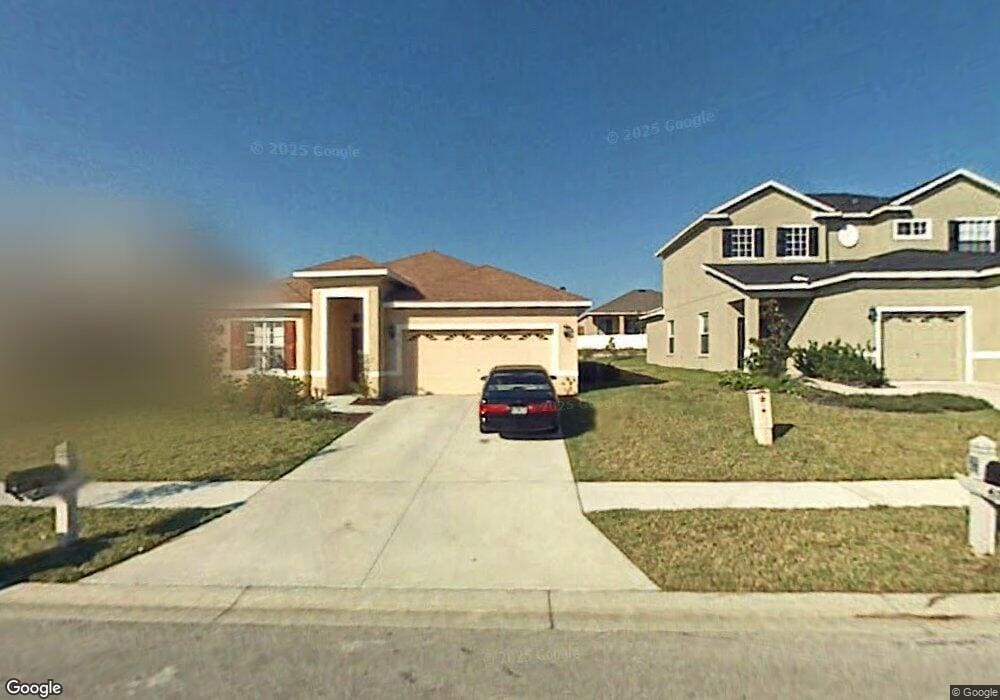
4169 Beaumont Loop Spring Hill, FL 34609
Estimated Value: $285,530 - $322,000
About This Home
This home is located at 4169 Beaumont Loop, Spring Hill, FL 34609 and is currently estimated at $302,383, approximately $161 per square foot. 4169 Beaumont Loop is a home located in Hernando County with nearby schools including Pine Grove Elementary School, West Hernando Middle School, and Central High School.
Ownership History
We collect this data history from publicly available records. To have your information removed, we recommend requesting removal directly through your county’s website.
Purchase Details
Home Financials for this Owner
Home Financials are based on the most recent Mortgage that was taken out on this home.Purchase Details
Purchase Details
Home Financials for this Owner
Home Financials are based on the most recent Mortgage that was taken out on this home.Home Values in the Area
Average Home Value in this Area
Purchase History
We collect this data history from publicly available records. To have your information removed, we recommend requesting removal directly through your county’s website.
| Date | Buyer | Sale Price | Title Company |
|---|---|---|---|
| $95,000 | Attorney | ||
| -- | None Available | ||
| $230,000 | Prominent Title Insurance Ag |
Mortgage History
We collect this data history from publicly available records. To have your information removed, we recommend requesting removal directly through your county’s website.
| Date | Status | Borrower | Loan Amount |
|---|---|---|---|
| Open | $78,756 | ||
| Previous Owner | $177,600 |
Tax History
We collect this data history from publicly available records. To have your information removed, we recommend requesting removal directly through your county’s website.
| Year | Tax Paid | Tax Assessment Tax Assessment Total Assessment is a certain percentage of the fair market value that is determined by local assessors to be the total taxable value of land and additions on the property. | Land | Improvement |
|---|---|---|---|---|
| 2025 | $3,136 | $68,713 | -- | -- |
| 2024 | $2,984 | $66,776 | -- | -- |
| 2023 | $2,984 | $64,831 | $0 | $0 |
| 2022 | $2,888 | $62,943 | $0 | $0 |
| 2021 | $486 | $61,110 | $0 | $0 |
| 2020 | $2,750 | $60,266 | $0 | $0 |
| 2019 | $2,769 | $58,911 | $0 | $0 |
| 2018 | $434 | $57,813 | $0 | $0 |
| 2017 | $2,460 | $56,624 | $0 | $0 |
| 2016 | $2,441 | $55,459 | $0 | $0 |
| 2015 | $2,416 | $55,073 | $0 | $0 |
| 2014 | $2,110 | $36,424 | $0 | $0 |
Map
- 13428 Mandalay Place
- 13250 Mandalay Place
- 12943 Impatiens St
- 4284 High Ridge Ave
- 4460 Birchfield Loop
- 4490 Ayrshire Dr
- 13444 Haverhill Dr
- 13628 Covey Run Place
- 13733 Covey Run Place
- 4269 Bramblewood Loop
- 13323 Bainbridge Way
- 12440 Langley Dr Unit Lot 81
- 12402 Langley Dr Unit Lot 77
- 12450 Langley Dr Unit Lot 82
- 12412 Langley Dr Unit Lot 78
- 12432 Langley Dr Unit Lot 80
- 12460 Langley Dr Unit Lot 83
- 12422 Langley Dr Unit Lot 79
- 4495 Edenrock Place
- 4771 Sand Ridge Blvd
- 4145 Beaumont Loop
- 4193 Beaumont Loop
- 3525 Beaumont Loop
- 4219 4219 Beaumont Loop
- 4123 Beaumont Loop
- 4219 Beaumont Loop
- 3549 Beaumont Loop
- 3505 Beaumont Loop
- 3575 Beaumont Loop
- 3483 Beaumont Loop
- 4146 Beaumont Loop
- 4170 Beaumont Loop
- 4099 Beaumont Loop
- 4241 Beaumont Loop
- 4194 Beaumont Loop
- 3595 Beaumont Loop
- 3457 Beaumont Loop
- 4100 Beaumont Loop
- 6482 Beaumont Loop
- 4220 4220 Beaumont Loop
Ask me questions while you tour the home.