4199 High St Thorndike, MA 01079
Estimated Value: $264,224 - $294,000
About This Home
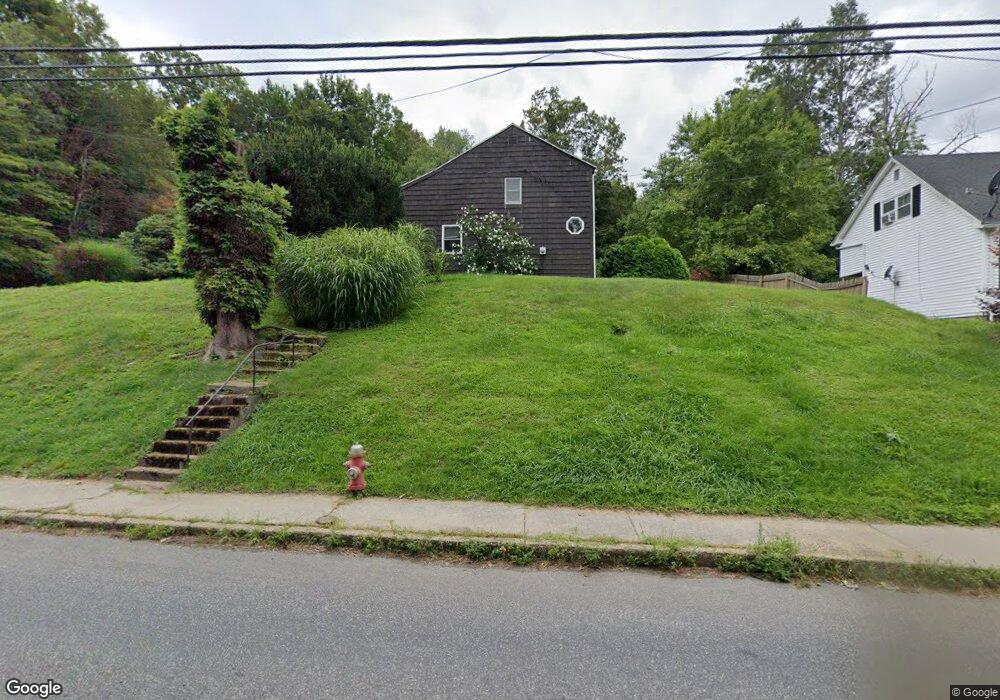
This home is located at 4199 High St, Thorndike, MA 01079 and is currently estimated at $277,056, approximately $254 per square foot. 4199 High St is a home with nearby schools including Old Mill Pond Elementary School, Palmer High School, and Converse Middle School.
Ownership History
We collect this data history from publicly available records. To have your information removed, we recommend requesting removal directly through your county’s website.
Purchase Details
Home Financials for this Owner
Home Financials are based on the most recent Mortgage that was taken out on this home.Purchase Details
Purchase Details
Home Values in the Area
Average Home Value in this Area
Purchase History
We collect this data history from publicly available records. To have your information removed, we recommend requesting removal directly through your county’s website.
| Date | Buyer | Sale Price | Title Company |
|---|---|---|---|
| $180,000 | -- | ||
| $180,000 | -- | ||
| $180,000 | -- | ||
| $81,000 | -- | ||
| $81,000 | -- | ||
| $85,000 | -- |
Mortgage History
We collect this data history from publicly available records. To have your information removed, we recommend requesting removal directly through your county’s website.
| Date | Status | Borrower | Loan Amount |
|---|---|---|---|
| Open | $144,000 | ||
| Closed | $36,000 | ||
| Closed | $144,000 | ||
| Previous Owner | $94,500 |
Tax History
We collect this data history from publicly available records. To have your information removed, we recommend requesting removal directly through your county’s website.
| Year | Tax Paid | Tax Assessment Tax Assessment Total Assessment is a certain percentage of the fair market value that is determined by local assessors to be the total taxable value of land and additions on the property. | Land | Improvement |
|---|---|---|---|---|
| 2025 | $3,610 | $197,500 | $64,400 | $133,100 |
| 2024 | $3,420 | $180,300 | $58,400 | $121,900 |
| 2023 | $3,408 | $169,900 | $58,400 | $111,500 |
| 2022 | $3,409 | $153,200 | $51,400 | $101,800 |
| 2021 | $3,397 | $143,800 | $56,800 | $87,000 |
| 2020 | $3,312 | $139,400 | $56,800 | $82,600 |
| 2019 | $3,315 | $139,400 | $56,800 | $82,600 |
| 2018 | $3,196 | $135,500 | $55,100 | $80,400 |
| 2017 | $3,118 | $135,500 | $55,100 | $80,400 |
| 2016 | $2,937 | $131,700 | $53,400 | $78,300 |
| 2015 | $2,849 | $131,700 | $53,400 | $78,300 |
Map
- 4030-4032 Pine St
- Lot 14 Center St
- 2 Elizabeth St
- 70 Summer St
- 50 Stimson St
- 12 Meadowbrook Ln
- 101 Ware St
- 0 Old Warren Rd
- 3012 Thorndike St
- 25 Flynt St
- Lot 34 Old Warren Rd
- 56 Quaboag Valley Co Op St Unit 56
- 22 Quaboag Valley Co-Op Unit 22
- 47 Fuller Rd
- 3080 Hillside Dr
- 44-50 Lawrence St
- 7,37,38 Thorndike and Lawrence St
- 0 St Unit 73414881
- 2B Forest Hill Dr
- 7 Caroline Cir
Ask me questions while you tour the home.