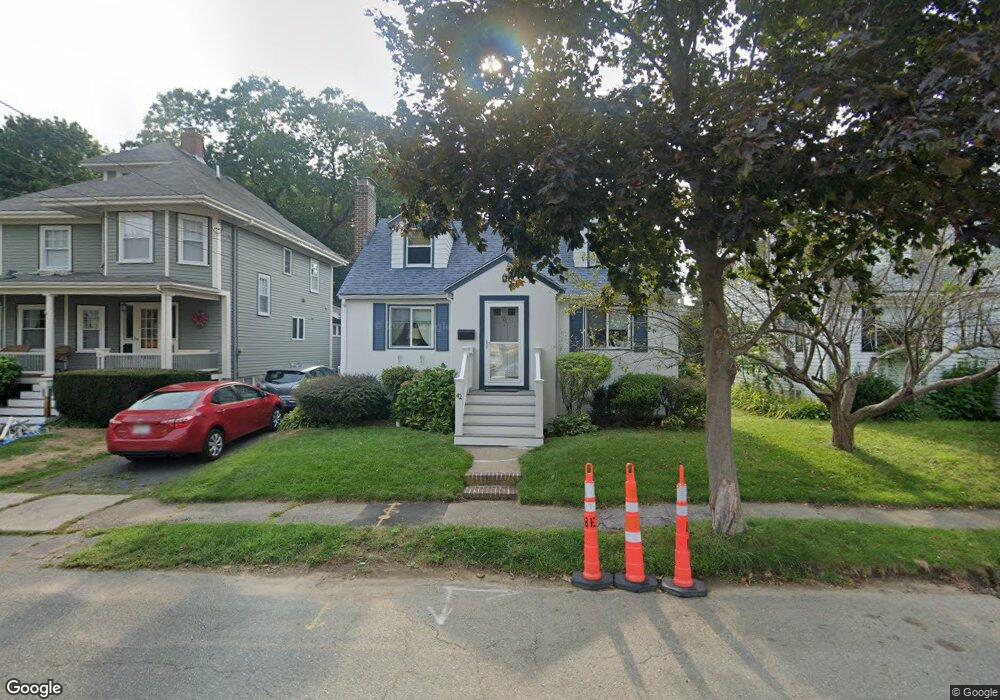
42 Bertram St Beverly, MA 01915
Downtown Beverly NeighborhoodEstimated Value: $810,180 - $878,000
About This Home
This home is located at 42 Bertram St, Beverly, MA 01915 and is currently estimated at $848,295, approximately $580 per square foot. 42 Bertram St is a home located in Essex County with nearby schools including Beverly High School, Harborlight Montessori School, and Mrs Alexander's School.
Ownership History
We collect this data history from publicly available records. To have your information removed, we recommend requesting removal directly through your county’s website.
Purchase Details
Home Financials for this Owner
Home Financials are based on the most recent Mortgage that was taken out on this home.Purchase Details
Purchase Details
Home Financials for this Owner
Home Financials are based on the most recent Mortgage that was taken out on this home.Purchase Details
Purchase Details
Purchase Details
Purchase Details
Purchase Details
Purchase Details
Home Values in the Area
Average Home Value in this Area
Purchase History
We collect this data history from publicly available records. To have your information removed, we recommend requesting removal directly through your county’s website.
| Date | Buyer | Sale Price | Title Company |
|---|---|---|---|
| -- | None Available | ||
| -- | -- | ||
| -- | -- | ||
| -- | -- | ||
| $351,000 | -- | ||
| $369,900 | -- | ||
| $350,000 | -- | ||
| $190,000 | -- | ||
| $158,000 | -- | ||
| $141,500 | -- |
Mortgage History
We collect this data history from publicly available records. To have your information removed, we recommend requesting removal directly through your county’s website.
| Date | Status | Borrower | Loan Amount |
|---|---|---|---|
| Previous Owner | $255,000 | ||
| Previous Owner | $280,000 |
Tax History
We collect this data history from publicly available records. To have your information removed, we recommend requesting removal directly through your county’s website.
| Year | Tax Paid | Tax Assessment Tax Assessment Total Assessment is a certain percentage of the fair market value that is determined by local assessors to be the total taxable value of land and additions on the property. | Land | Improvement |
|---|---|---|---|---|
| 2025 | $7,358 | $669,500 | $432,000 | $237,500 |
| 2024 | $6,896 | $614,100 | $376,600 | $237,500 |
| 2023 | $6,603 | $586,400 | $348,900 | $237,500 |
| 2022 | $6,238 | $512,600 | $275,100 | $237,500 |
| 2021 | $6,176 | $486,300 | $262,100 | $224,200 |
| 2020 | $5,931 | $462,300 | $238,100 | $224,200 |
| 2019 | $5,748 | $435,100 | $217,800 | $217,300 |
| 2015 | $4,954 | $351,100 | $153,200 | $197,900 |
Map
- 21 Whitney Ave Unit 1
- 26 Heather St
- 17 Ames St
- 6 Lenox St Unit 1
- 10 Pearl Street Extension
- 60 Lakeshore Ave
- 335 Cabot St
- 335 & 335R Cabot St
- 435 Cabot St Unit B
- 38 Brimbal Ave
- 8 Baker Ave
- 2 Mill St
- 68 Paine Ave
- 5 Beckford St Unit 3
- 5 Palmer Rd
- 11 East St
- 44 Charnock St
- 37 Chase St
- 492 Cabot St Unit 1A
- 14 Lawrence St
Ask me questions while you tour the home.