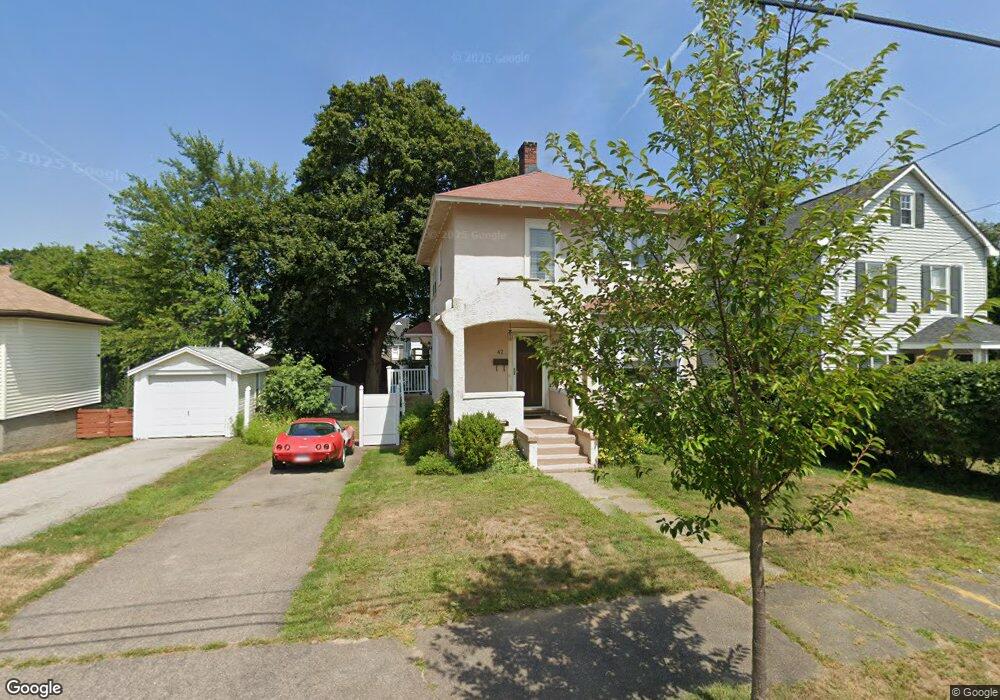
42 Bittern Rd Quincy, MA 02169
Adams Shore NeighborhoodEstimated Value: $549,988 - $654,000
2
Beds
1
Bath
1,124
Sq Ft
$535/Sq Ft
Est. Value
About This Home
This home is located at 42 Bittern Rd, Quincy, MA 02169 and is currently estimated at $600,997, approximately $534 per square foot. 42 Bittern Rd is a home located in Norfolk County with nearby schools including Merrymount Elementary School, Broad Meadows Middle School, and Quincy High School.
Ownership History
Date
Name
Owned For
Owner Type
Purchase Details
Closed on
May 2, 2011
Sold by
Sutherland Sarah
Bought by
Sutherland Sarah E and Sutherland David G
Current Estimated Value
Home Financials for this Owner
Home Financials are based on the most recent Mortgage that was taken out on this home.
Original Mortgage
$130,000
Outstanding Balance
$89,843
Interest Rate
4.76%
Mortgage Type
Purchase Money Mortgage
Estimated Equity
$511,154
Create a Home Valuation Report for This Property
The Home Valuation Report is an in-depth analysis detailing your home's value as well as a comparison with similar homes in the area
Home Values in the Area
Average Home Value in this Area
Purchase History
| Date | Buyer | Sale Price | Title Company |
|---|---|---|---|
| Sutherland Sarah E | -- | -- |
Source: Public Records
Mortgage History
| Date | Status | Borrower | Loan Amount |
|---|---|---|---|
| Open | Sutherland Sarah E | $130,000 |
Source: Public Records
Tax History
| Year | Tax Paid | Tax Assessment Tax Assessment Total Assessment is a certain percentage of the fair market value that is determined by local assessors to be the total taxable value of land and additions on the property. | Land | Improvement |
|---|---|---|---|---|
| 2025 | $5,833 | $505,900 | $282,000 | $223,900 |
| 2024 | $5,559 | $493,300 | $273,800 | $219,500 |
| 2023 | $4,923 | $442,300 | $238,100 | $204,200 |
| 2022 | $4,797 | $400,400 | $216,400 | $184,000 |
| 2021 | $4,777 | $393,500 | $216,400 | $177,100 |
| 2020 | $4,533 | $364,700 | $208,100 | $156,600 |
| 2019 | $4,323 | $344,500 | $194,500 | $150,000 |
| 2018 | $4,099 | $307,300 | $169,100 | $138,200 |
| 2017 | $4,173 | $294,500 | $169,100 | $125,400 |
| 2016 | $4,130 | $287,600 | $169,100 | $118,500 |
| 2015 | $3,919 | $268,400 | $159,600 | $108,800 |
| 2014 | $3,731 | $251,100 | $152,000 | $99,100 |
Source: Public Records
Map
Nearby Homes
- 59 Terne Rd
- 11 Riverside Ave
- 1 Homer Rd
- 105 Sea St Unit 105
- 105 Sea St Unit 102
- 200 Cove Way Unit 1004
- 173 Rhoda St
- 51 Stoughton St
- 388 Washington St Unit 101
- 388 Washington St Unit 401
- 388 Washington St Unit 405
- 161 Sumner St Unit 2
- 270 Southern Artery
- 17-19 Lowe St
- 202 Manet Ave
- 585 Washington St Unit 202
- 585 Washington St Unit 301
- 585 Washington St Unit model-1
- 62 Lawn Ave
- 27 6th Ave
Your Personal Tour Guide
Ask me questions while you tour the home.