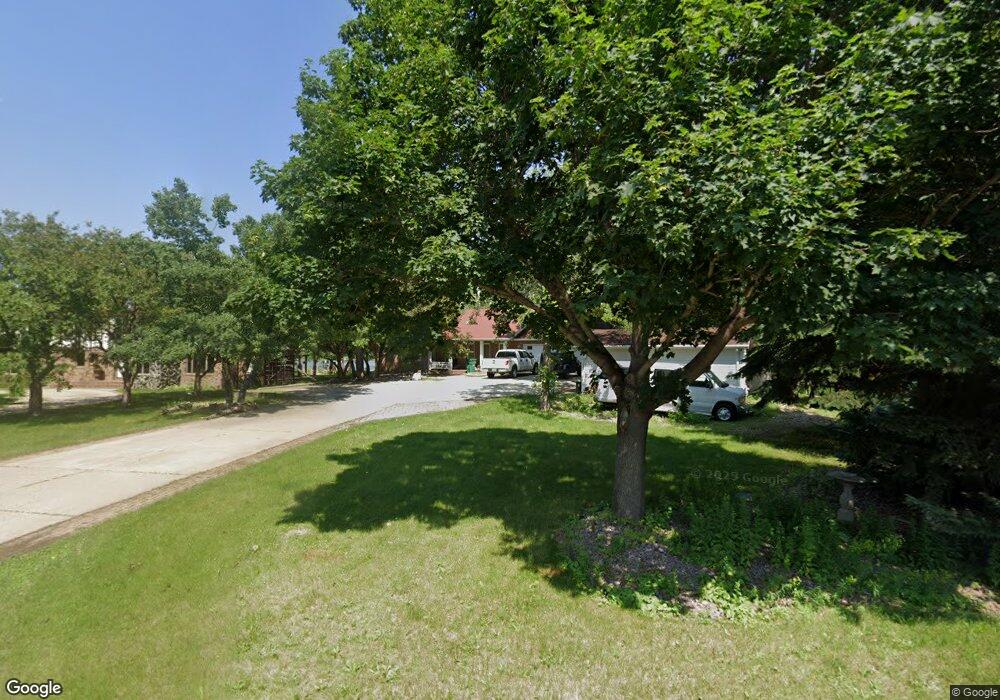
42 Captain Marsh Dr Mandan, ND 58554
Estimated Value: $604,000 - $924,000
4
Beds
3
Baths
3,618
Sq Ft
$210/Sq Ft
Est. Value
About This Home
This home is located at 42 Captain Marsh Dr, Mandan, ND 58554 and is currently estimated at $759,761, approximately $209 per square foot. 42 Captain Marsh Dr is a home located in Morton County with nearby schools including Lewis & Clark Elementary School, Mandan Middle School, and Mandan High School.
Ownership History
Date
Name
Owned For
Owner Type
Purchase Details
Closed on
Jul 10, 2024
Sold by
Armstrong Michael Jeffrey
Bought by
Armstrong Michael Jackson
Current Estimated Value
Purchase Details
Closed on
Sep 16, 2011
Sold by
Schoregge Iris M and Wheeler Ronald W
Bought by
Mayer Greg
Purchase Details
Closed on
Nov 10, 2010
Sold by
Schoregge Iris M and Wheeler Ronald W
Bought by
Schoregge Iris M and Schoregge Diane L
Create a Home Valuation Report for This Property
The Home Valuation Report is an in-depth analysis detailing your home's value as well as a comparison with similar homes in the area
Home Values in the Area
Average Home Value in this Area
Purchase History
| Date | Buyer | Sale Price | Title Company |
|---|---|---|---|
| Armstrong Michael Jackson | -- | None Listed On Document | |
| Armstrong Michael Jeffrey | -- | None Listed On Document | |
| Mayer Greg | -- | North Dakota Guaranty & Titl | |
| Schoregge Iris M | -- | None Available |
Source: Public Records
Tax History
| Year | Tax Paid | Tax Assessment Tax Assessment Total Assessment is a certain percentage of the fair market value that is determined by local assessors to be the total taxable value of land and additions on the property. | Land | Improvement |
|---|---|---|---|---|
| 2025 | $5,956 | $332,000 | $67,350 | $264,650 |
| 2024 | $67 | $286,400 | $0 | $0 |
| 2023 | $6,525 | $324,050 | $67,350 | $256,700 |
| 2022 | $5,082 | $253,650 | $41,950 | $211,700 |
| 2021 | $4,650 | $232,100 | $47,050 | $185,050 |
| 2020 | $4,398 | $231,150 | $47,050 | $184,100 |
| 2019 | $4,497 | $230,700 | $0 | $0 |
| 2018 | $4,316 | $230,450 | $47,050 | $183,400 |
| 2017 | $4,257 | $229,700 | $47,050 | $182,650 |
| 2016 | $3,926 | $217,750 | $47,050 | $170,700 |
| 2015 | $3,732 | $206,650 | $47,050 | $159,600 |
| 2014 | $3,779 | $204,750 | $49,400 | $155,350 |
| 2013 | $3,644 | $189,550 | $47,050 | $142,500 |
Source: Public Records
Map
Nearby Homes
- 2207 Bridgeview Ct
- 2223 Bridgeview Ct
- 2313 Pirates Loop SE
- 2321 Bayview Ct
- 566 Sunset Place
- 4500 Sundancer Loop SE Unit 2
- 2425 Water Park Loop SE
- 2445 Waterpark Loop SE
- 2454 Waterpark Loop SE
- 1148 S Highland Acres Rd
- 1120 Keating Dr
- 2617 Verity Ln SE
- 2616 Douglas Place SE
- 2601 Douglas Place SE
- 2806 Waters Edge Ln SE
- 2625 Douglas Place SE
- 1009 Lake Ave
- 3714 Amity Cir SE
- 3834 Gale Cir SE
- 1232 E Coulee Rd
- 41 Captain Marsh Dr
- 43 Captain Marsh Dr
- 0 Captain Marsh Dr
- 44 Captain Marsh Dr
- 40 Captain Marsh Dr
- 54 Captain Marsh Dr
- 53 Captain Marsh Dr
- 52 Captain Marsh Dr
- 55 Captain Marsh Dr
- 45 Captain Marsh Dr
- 39 Captain Marsh Dr
- 51 Captain Marsh Dr
- 38 Captain Marsh Dr
- 46 Captain Marsh Dr
- 50 Captain Marsh Dr
- 47 Captain Marsh Dr
- 59 Captain Marsh Dr
- 49 Captain Marsh Dr
- 62 Captain Leach Dr
- 37 Captain Marsh Dr
Your Personal Tour Guide
Ask me questions while you tour the home.