42 Chartwell Dr Bourne, MA 2532
Estimated Value: $574,976 - $668,000
About This Home
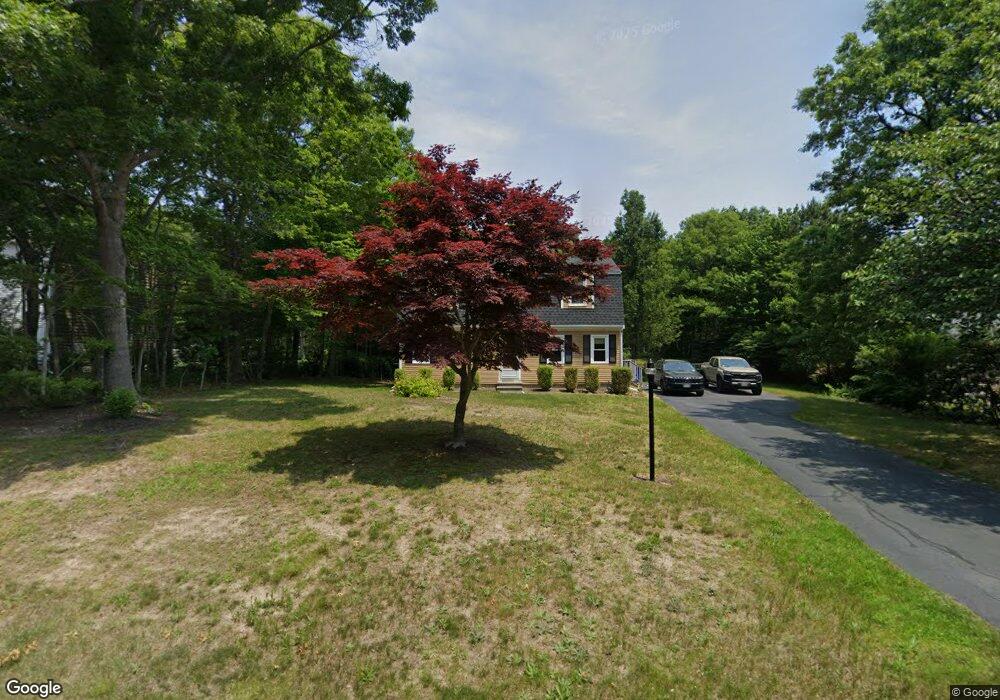
This home is located at 42 Chartwell Dr, Bourne, MA 2532 and is currently estimated at $615,244, approximately $356 per square foot. 42 Chartwell Dr is a home located in Barnstable County with nearby schools including Bourne High School and Bridgeview Montessori School.
Ownership History
We collect this data history from publicly available records. To have your information removed, we recommend requesting removal directly through your county’s website.
Purchase Details
Home Financials for this Owner
Home Financials are based on the most recent Mortgage that was taken out on this home.Purchase Details
Purchase Details
Home Financials for this Owner
Home Financials are based on the most recent Mortgage that was taken out on this home.Purchase Details
Home Financials for this Owner
Home Financials are based on the most recent Mortgage that was taken out on this home.Purchase Details
Purchase History
We collect this data history from publicly available records. To have your information removed, we recommend requesting removal directly through your county’s website.
| Date | Buyer | Sale Price | Title Company |
|---|---|---|---|
| $408,000 | None Available | ||
| $408,000 | None Available | ||
| $395,000 | None Available | ||
| $395,000 | None Available | ||
| $310,000 | -- | ||
| $310,000 | -- | ||
| $295,000 | -- | ||
| $295,000 | -- | ||
| $119,060 | -- | ||
| $119,060 | -- |
Mortgage History
We collect this data history from publicly available records. To have your information removed, we recommend requesting removal directly through your county’s website.
| Date | Status | Borrower | Loan Amount |
|---|---|---|---|
| Open | $400,000 | ||
| Closed | $400,000 | ||
| Previous Owner | $248,000 | ||
| Previous Owner | $289,656 | ||
| Previous Owner | $212,000 |
Tax History
We collect this data history from publicly available records. To have your information removed, we recommend requesting removal directly through your county’s website.
| Year | Tax Paid | Tax Assessment Tax Assessment Total Assessment is a certain percentage of the fair market value that is determined by local assessors to be the total taxable value of land and additions on the property. | Land | Improvement |
|---|---|---|---|---|
| 2025 | $3,624 | $464,000 | $170,200 | $293,800 |
| 2024 | $3,543 | $441,800 | $162,100 | $279,700 |
| 2023 | $3,585 | $406,900 | $159,400 | $247,500 |
| 2022 | $3,870 | $383,500 | $141,000 | $242,500 |
| 2021 | $3,285 | $305,000 | $128,400 | $176,600 |
| 2020 | $3,179 | $296,000 | $127,100 | $168,900 |
| 2019 | $3,032 | $288,500 | $127,100 | $161,400 |
| 2018 | $2,916 | $276,700 | $121,100 | $155,600 |
| 2017 | $2,837 | $275,400 | $120,000 | $155,400 |
| 2016 | $2,759 | $271,600 | $119,900 | $151,700 |
| 2015 | -- | $271,600 | $119,900 | $151,700 |
Map
- 0 State Rd
- 14 Sir Lancelot Dr
- 16 Ocean Pines Dr Unit A
- 9 Eagle Hill Dr
- 209 Herring Pond Rd
- 4 Kimba Ln
- 1 Homestead Rd
- 7 Great Pine Dr
- 29 Eagle Hill Dr
- 15 Clark Rd
- 4 Andrew Rd
- 1 Peaked Cliff Rd
- 18 Remington Ln
- 88 Sagamore Rd
- 22 Indian Trail
- 26 Indian Trail
- 19 Colt Ln
- 133 Phillips Rd
- 53 Pawtuxet Rd
- 30 Pawtuxet Rd
- 42 Chart Well Dr
- 40 Chartwell Dr
- 44 Chart Well Dr
- 40 Chart Well Dr
- 44 Chartwell Dr
- 47 Chartwell
- 46 Chart Well Dr
- 43 Chartwell Dr
- 43 Chart Well Dr
- 46 Chartwell Dr
- 41 Chart Well Dr
- 39 Chart Well Dr
- 45 Chart Well Dr
- 47 Chart Well Dr
- 48 Chart Well Dr
- 36 Chartwell Dr
- 36 Chart Well Dr
- 35 Chart Well Dr
- 2 Lord Hayford Rd
- 2 Lord Hayford Rd Unit 2
Ask me questions while you tour the home.