42 Crowninshield St Providence, RI 02909
Hartford NeighborhoodEstimated Value: $602,000 - $750,200
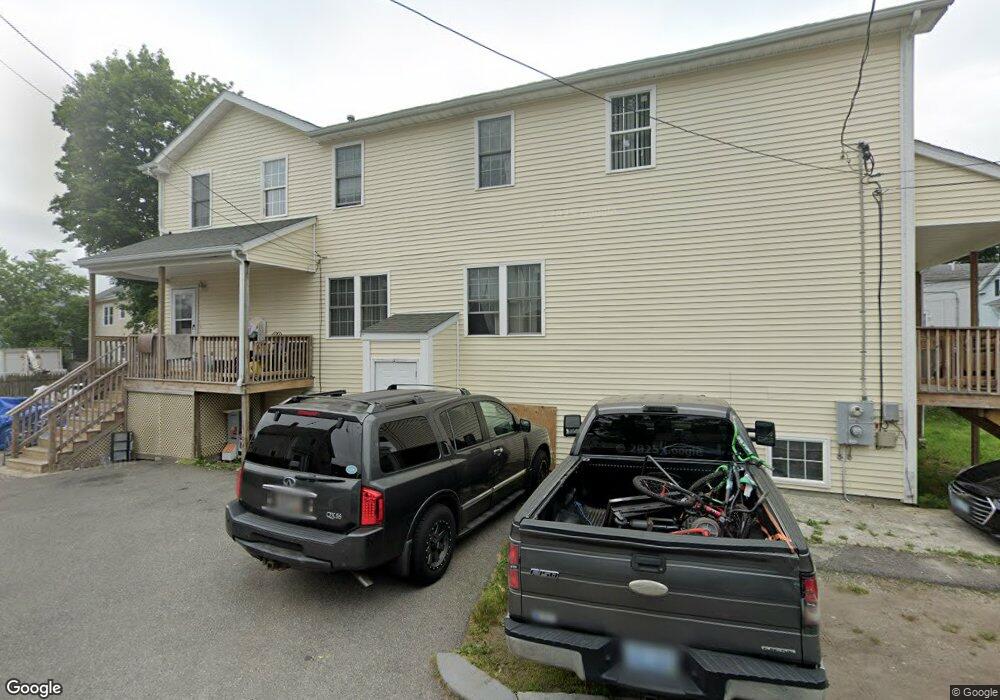
About This Home
This home is located at 42 Crowninshield St, Providence, RI 02909 and is currently estimated at $686,050, approximately $244 per square foot. 42 Crowninshield St is a home located in Providence County with nearby schools including Pleasant View Elementary School, Robert F. Kennedy El. School, and Alfred Lima Sr. Elementary School.
Ownership History
We collect this data history from publicly available records. To have your information removed, we recommend requesting removal directly through your county’s website.
Purchase Details
Home Financials for this Owner
Home Financials are based on the most recent Mortgage that was taken out on this home.Purchase Details
Home Values in the Area
Average Home Value in this Area
Purchase History
We collect this data history from publicly available records. To have your information removed, we recommend requesting removal directly through your county’s website.
| Date | Buyer | Sale Price | Title Company |
|---|---|---|---|
| $345,000 | -- | ||
| $78,000 | -- |
Mortgage History
We collect this data history from publicly available records. To have your information removed, we recommend requesting removal directly through your county’s website.
| Date | Status | Borrower | Loan Amount |
|---|---|---|---|
| Open | $69,000 |
Tax History
We collect this data history from publicly available records. To have your information removed, we recommend requesting removal directly through your county’s website.
| Year | Tax Paid | Tax Assessment Tax Assessment Total Assessment is a certain percentage of the fair market value that is determined by local assessors to be the total taxable value of land and additions on the property. | Land | Improvement |
|---|---|---|---|---|
| 2025 | $5,030 | $666,200 | $130,900 | $535,300 |
| 2024 | $8,612 | $469,300 | $73,600 | $395,700 |
| 2023 | $8,612 | $469,300 | $73,600 | $395,700 |
| 2022 | $8,354 | $469,300 | $73,600 | $395,700 |
| 2021 | $7,997 | $325,600 | $49,300 | $276,300 |
| 2020 | $7,997 | $325,600 | $49,300 | $276,300 |
| 2019 | $7,997 | $325,600 | $49,300 | $276,300 |
| 2018 | $7,111 | $222,500 | $47,800 | $174,700 |
| 2017 | $7,111 | $222,500 | $47,800 | $174,700 |
| 2016 | $7,111 | $222,500 | $47,800 | $174,700 |
| 2015 | $6,693 | $202,200 | $50,800 | $151,400 |
| 2014 | $6,824 | $202,200 | $50,800 | $151,400 |
| 2013 | $6,824 | $202,200 | $50,800 | $151,400 |
Map
- 104 Alverson Ave
- 231 Lowell Ave
- 219 Lowell Ave
- 240 Eastwood Ave
- 29 Matson Ave Unit 4D
- 110 Petteys Ave
- 15 Melissa St
- 64 Dresser St
- 162 Eastwood Ave
- 173 Whittier Ave
- 60 Ophelia St
- 66 Ophelia St
- 36 Duxbury St
- 665 Plainfield St
- 35 Lawrence St
- 122 Laban St
- 59 Webster Ave
- 14 Seton St
- 243 Killingly St
- 121 Barbara St
Ask me questions while you tour the home.