42 Forest St Peabody, MA 01960
Estimated Value: $575,701 - $594,000
About This Home
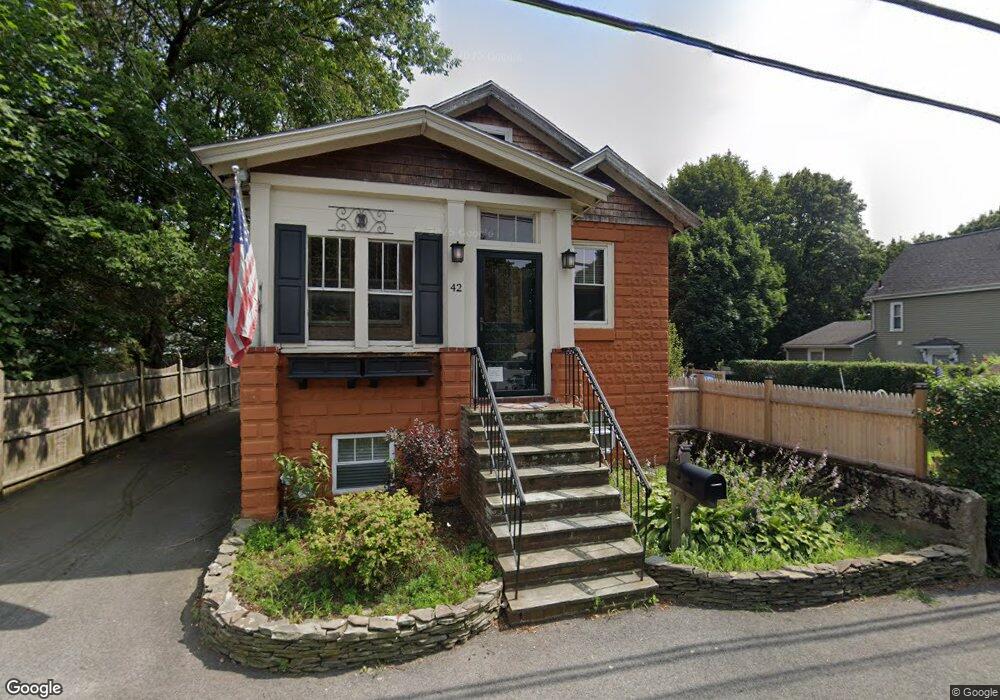
This home is located at 42 Forest St, Peabody, MA 01960 and is currently estimated at $583,925, approximately $412 per square foot. 42 Forest St is a home located in Essex County with nearby schools including Peabody Veterans Memorial High School and St John The Baptist School.
Ownership History
We collect this data history from publicly available records. To have your information removed, we recommend requesting removal directly through your county’s website.
Purchase Details
Purchase Details
Purchase Details
Home Financials for this Owner
Home Financials are based on the most recent Mortgage that was taken out on this home.Purchase Details
Purchase Details
Purchase Details
Purchase History
We collect this data history from publicly available records. To have your information removed, we recommend requesting removal directly through your county’s website.
| Date | Buyer | Sale Price | Title Company |
|---|---|---|---|
| -- | -- | ||
| -- | -- | ||
| $189,000 | -- | ||
| -- | -- | ||
| -- | -- | ||
| -- | -- |
Mortgage History
We collect this data history from publicly available records. To have your information removed, we recommend requesting removal directly through your county’s website.
| Date | Status | Borrower | Loan Amount |
|---|---|---|---|
| Previous Owner | $231,800 | ||
| Previous Owner | $228,375 | ||
| Previous Owner | $185,440 |
Tax History
We collect this data history from publicly available records. To have your information removed, we recommend requesting removal directly through your county’s website.
| Year | Tax Paid | Tax Assessment Tax Assessment Total Assessment is a certain percentage of the fair market value that is determined by local assessors to be the total taxable value of land and additions on the property. | Land | Improvement |
|---|---|---|---|---|
| 2025 | $4,305 | $464,900 | $218,800 | $246,100 |
| 2024 | $3,994 | $437,900 | $218,800 | $219,100 |
| 2023 | $3,568 | $374,800 | $195,400 | $179,400 |
| 2022 | $3,939 | $390,000 | $174,500 | $215,500 |
| 2021 | $3,424 | $326,400 | $158,600 | $167,800 |
| 2020 | $3,653 | $340,100 | $158,600 | $181,500 |
| 2019 | $3,488 | $316,800 | $158,600 | $158,200 |
| 2018 | $3,328 | $290,400 | $144,200 | $146,200 |
| 2017 | $3,051 | $259,400 | $144,200 | $115,200 |
| 2016 | $2,758 | $231,400 | $144,200 | $87,200 |
| 2015 | $2,964 | $241,000 | $140,600 | $100,400 |
Map
- 8 Bartlett St
- 1 Douglas St
- 500 Northshore Rd Unit 4C
- 47 Emerson Street Extension
- 5 Charles St
- 38-1/2 Ellsworth Rd
- 3 Southwick Rd
- 23 Kosciusko St
- 17 Kosciusko St
- 16 Palmer Ave Unit 2
- 3 Fitz Rd
- 6 Rawding Rd
- 112 Lowell St Unit 11
- 10 Crowninshield St Unit 106
- 395 Lowell St
- 6 Buttonwood Ln
- 33 Warren St
- 2 Johnson Ave
- 9 Reynolds Rd
- 12 Johnson Ave
Ask me questions while you tour the home.