42 Manning St Chicopee, MA 01020
Fairview NeighborhoodEstimated Value: $322,000 - $352,000
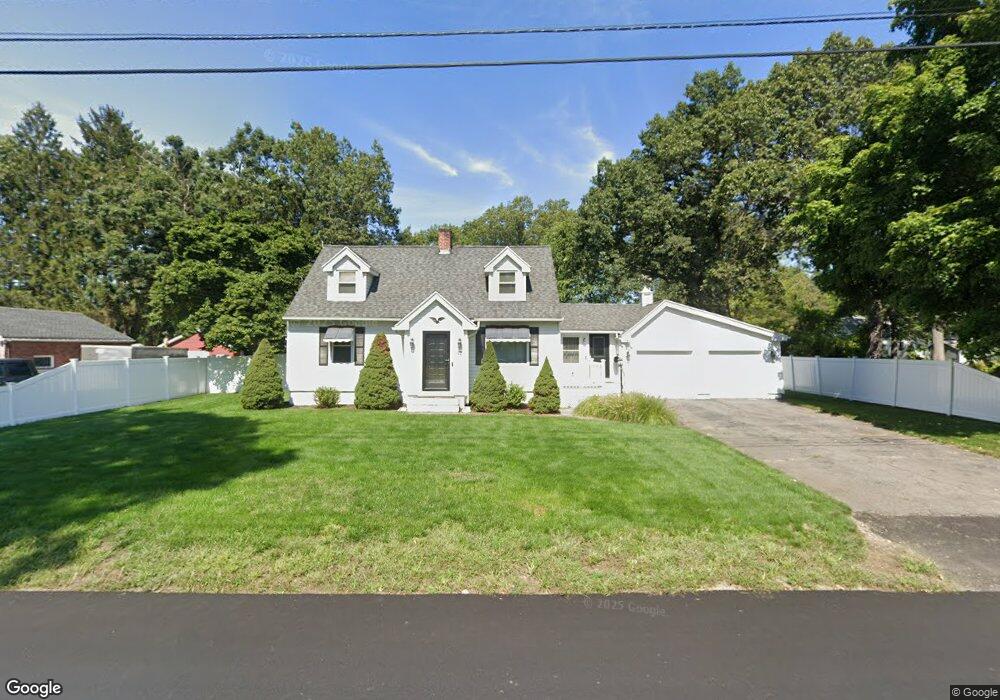
About This Home
This home is located at 42 Manning St, Chicopee, MA 01020 and is currently estimated at $336,691, approximately $313 per square foot. 42 Manning St is a home located in Hampden County with nearby schools including Streiber Elementary School, Fairview Middle School, and Chicopee Comprehensive High School.
Ownership History
We collect this data history from publicly available records. To have your information removed, we recommend requesting removal directly through your county’s website.
Purchase Details
Home Financials for this Owner
Home Financials are based on the most recent Mortgage that was taken out on this home.Home Values in the Area
Average Home Value in this Area
Purchase History
We collect this data history from publicly available records. To have your information removed, we recommend requesting removal directly through your county’s website.
| Date | Buyer | Sale Price | Title Company |
|---|---|---|---|
| $170,000 | -- |
Mortgage History
We collect this data history from publicly available records. To have your information removed, we recommend requesting removal directly through your county’s website.
| Date | Status | Borrower | Loan Amount |
|---|---|---|---|
| Open | $153,000 |
Tax History
We collect this data history from publicly available records. To have your information removed, we recommend requesting removal directly through your county’s website.
| Year | Tax Paid | Tax Assessment Tax Assessment Total Assessment is a certain percentage of the fair market value that is determined by local assessors to be the total taxable value of land and additions on the property. | Land | Improvement |
|---|---|---|---|---|
| 2025 | $3,978 | $262,400 | $111,800 | $150,600 |
| 2024 | $3,774 | $255,700 | $109,600 | $146,100 |
| 2023 | $3,607 | $238,100 | $99,600 | $138,500 |
| 2022 | $3,534 | $208,000 | $86,600 | $121,400 |
| 2021 | $3,344 | $189,900 | $78,700 | $111,200 |
| 2020 | $3,234 | $185,200 | $80,900 | $104,300 |
| 2019 | $3,204 | $178,400 | $80,900 | $97,500 |
| 2018 | $3,104 | $169,500 | $77,100 | $92,400 |
| 2017 | $2,808 | $162,200 | $70,700 | $91,500 |
| 2016 | $2,687 | $158,900 | $70,700 | $88,200 |
| 2015 | $2,773 | $158,100 | $70,700 | $87,400 |
| 2014 | $1,387 | $158,100 | $70,700 | $87,400 |
Map
- 67 Manning St
- 523 James St
- 9 Dowds Ln
- 85 Barbara St
- 34 Allen St
- 33 Guerin St
- 522 Prospect St
- 0 Saint Jacques Ave
- 200 Royal St
- 98 Greenpoint Cir
- 20 Bourbeau St
- 303 College St
- 128 Ann St
- 35 N Summer St
- 23 Mountainview St
- 6 Center St
- 83 Buckley Blvd
- 91 Shadow Brook Estate Unit 91
- 55 Meadowlark Ln
- 10 Lawrence Ave
Ask me questions while you tour the home.