42 Marsh Ave Worcester, MA 01605
Estimated Value: $394,000 - $510,000
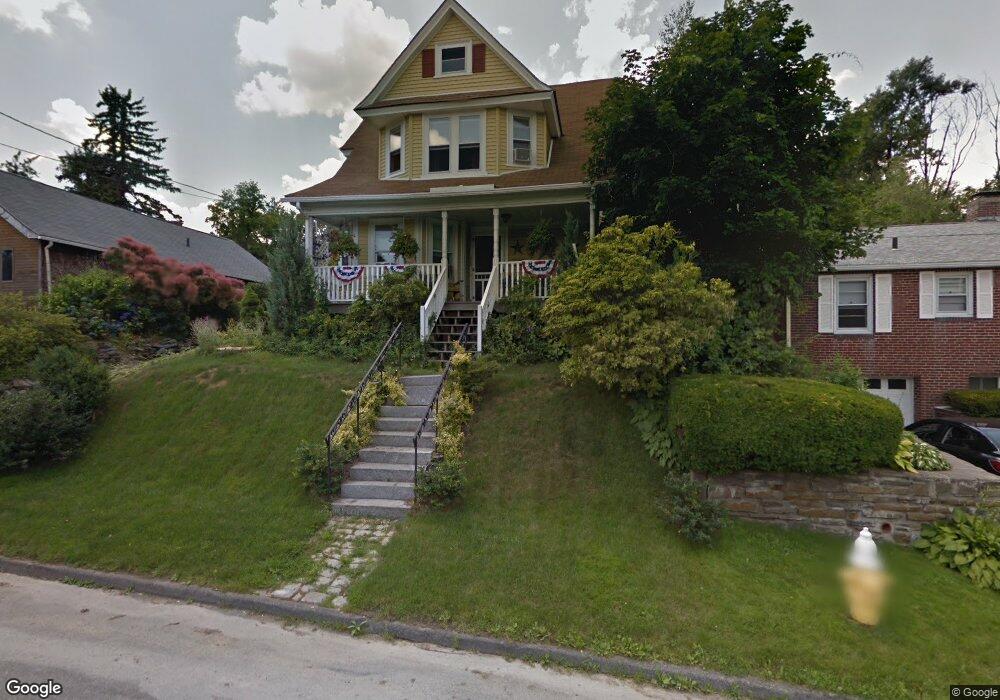
About This Home
This home is located at 42 Marsh Ave, Worcester, MA 01605 and is currently estimated at $461,822, approximately $213 per square foot. 42 Marsh Ave is a home located in Worcester County with nearby schools including Jacob Hiatt Magnet School, Chandler Magnet, and Lincoln Street School.
Ownership History
We collect this data history from publicly available records. To have your information removed, we recommend requesting removal directly through your county’s website.
Purchase Details
Purchase Details
Purchase History
We collect this data history from publicly available records. To have your information removed, we recommend requesting removal directly through your county’s website.
| Date | Buyer | Sale Price | Title Company |
|---|---|---|---|
| -- | None Available | ||
| $75,000 | -- |
Mortgage History
We collect this data history from publicly available records. To have your information removed, we recommend requesting removal directly through your county’s website.
| Date | Status | Borrower | Loan Amount |
|---|---|---|---|
| Closed | $250,477 | ||
| Closed | $20,000 | ||
| Closed | $25,500 | ||
| Closed | $32,304 | ||
| Closed | $142,500 | ||
| Closed | $52,900 | ||
| Closed | $35,300 | ||
| Closed | $14,000 | ||
| Closed | $74,263 |
Tax History
We collect this data history from publicly available records. To have your information removed, we recommend requesting removal directly through your county’s website.
| Year | Tax Paid | Tax Assessment Tax Assessment Total Assessment is a certain percentage of the fair market value that is determined by local assessors to be the total taxable value of land and additions on the property. | Land | Improvement |
|---|---|---|---|---|
| 2025 | $5,624 | $426,400 | $107,900 | $318,500 |
| 2024 | $5,352 | $389,200 | $107,900 | $281,300 |
| 2023 | $5,161 | $359,900 | $93,800 | $266,100 |
| 2022 | $4,779 | $314,200 | $75,100 | $239,100 |
| 2021 | $4,866 | $298,900 | $60,100 | $238,800 |
| 2020 | $4,599 | $270,500 | $60,100 | $210,400 |
| 2019 | $4,417 | $245,400 | $54,000 | $191,400 |
| 2018 | $4,387 | $232,000 | $54,000 | $178,000 |
| 2017 | $4,177 | $217,300 | $54,000 | $163,300 |
| 2016 | $4,242 | $205,800 | $40,900 | $164,900 |
| 2015 | $4,130 | $205,800 | $40,900 | $164,900 |
| 2014 | $4,021 | $205,800 | $40,900 | $164,900 |
Map
- 31 Colby Ave
- 11 Wakefield St
- 3 Wallace St
- 19 Denmark St
- 51 Uxbridge St
- 40 Duxbury Rd
- 46 North Pkwy
- 2 Davidson Rd
- 19 Barnard Rd
- 31 Barnard Rd
- 42 Windsor St
- 25 Kenwood Ave
- 24 Paper Birch Path
- 223 Beverly Rd
- 64 Wauwinet Rd
- 104 1/2 Rodney St
- 80 Stanton St Unit 36
- 91-93 Natural History Dr
- 56 Paine St
- 178 Lincoln St Unit 15
Ask me questions while you tour the home.