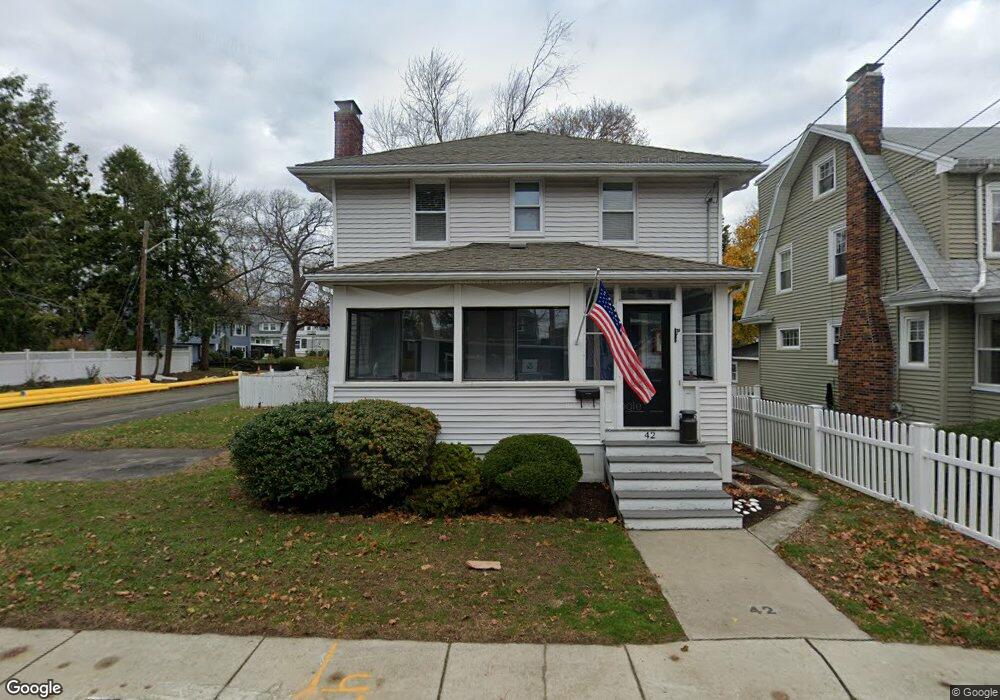
42 Ocean St Quincy, MA 02171
North Quincy NeighborhoodEstimated Value: $695,712 - $733,000
3
Beds
2
Baths
1,248
Sq Ft
$577/Sq Ft
Est. Value
About This Home
This home is located at 42 Ocean St, Quincy, MA 02171 and is currently estimated at $720,178, approximately $577 per square foot. 42 Ocean St is a home located in Norfolk County with nearby schools including Squantum Elementary School, Atlantic Middle School, and North Quincy High School.
Ownership History
Date
Name
Owned For
Owner Type
Purchase Details
Closed on
Jun 30, 2011
Sold by
Ocean Street Rt and Feeley Barbara G
Bought by
Crean Kevin
Current Estimated Value
Home Financials for this Owner
Home Financials are based on the most recent Mortgage that was taken out on this home.
Original Mortgage
$319,761
Outstanding Balance
$221,125
Interest Rate
4.62%
Mortgage Type
Purchase Money Mortgage
Estimated Equity
$499,053
Create a Home Valuation Report for This Property
The Home Valuation Report is an in-depth analysis detailing your home's value as well as a comparison with similar homes in the area
Home Values in the Area
Average Home Value in this Area
Purchase History
We collect this data history from publicly available records. To have your information removed, we recommend requesting removal directly through your county’s website.
| Date | Buyer | Sale Price | Title Company |
|---|---|---|---|
| Crean Kevin | $325,000 | -- |
Source: Public Records
Mortgage History
We collect this data history from publicly available records. To have your information removed, we recommend requesting removal directly through your county’s website.
| Date | Status | Borrower | Loan Amount |
|---|---|---|---|
| Open | Crean Kevin | $319,761 |
Source: Public Records
Tax History
| Year | Tax Paid | Tax Assessment Tax Assessment Total Assessment is a certain percentage of the fair market value that is determined by local assessors to be the total taxable value of land and additions on the property. | Land | Improvement |
|---|---|---|---|---|
| 2025 | $7,410 | $642,700 | $366,000 | $276,700 |
| 2024 | $7,181 | $637,200 | $366,000 | $271,200 |
| 2023 | $6,516 | $585,400 | $332,800 | $252,600 |
| 2022 | $5,946 | $496,300 | $266,200 | $230,100 |
| 2021 | $5,895 | $485,600 | $266,200 | $219,400 |
| 2020 | $5,688 | $457,600 | $261,000 | $196,600 |
| 2019 | $5,504 | $438,600 | $251,000 | $187,600 |
| 2018 | $5,507 | $412,800 | $239,000 | $173,800 |
| 2017 | $5,317 | $375,200 | $217,300 | $157,900 |
| 2016 | $4,976 | $346,500 | $197,500 | $149,000 |
| 2015 | $4,622 | $316,600 | $179,600 | $137,000 |
| 2014 | $4,510 | $303,500 | $179,600 | $123,900 |
Source: Public Records
Map
Nearby Homes
- 228 Quincy Shore Dr
- 212 Quincy Shore Dr
- 75 Walker St
- 175 Quincy Shore Dr Unit B33
- 175 Quincy Shore Dr Unit B66
- 175 Quincy Shore Dr Unit B23
- 27 Herbert Rd
- 90 Quincy Shore Dr Unit 311
- 90 Quincy Shore Dr Unit 302
- 156 Crabtree Rd
- 46 Warwick St
- 133 Commander Shea Blvd Unit 502
- 133 Commander Shea Blvd Unit 505
- 150 Hancock St Unit 101
- 100 Marina Dr Unit 418
- 153 Vassall St
- 10 Seaport Dr Unit 2311
- 63 Crabtree Rd
- 7 Cutter Ln
- 63 Crabtree Rd (Lot B)
Your Personal Tour Guide
Ask me questions while you tour the home.