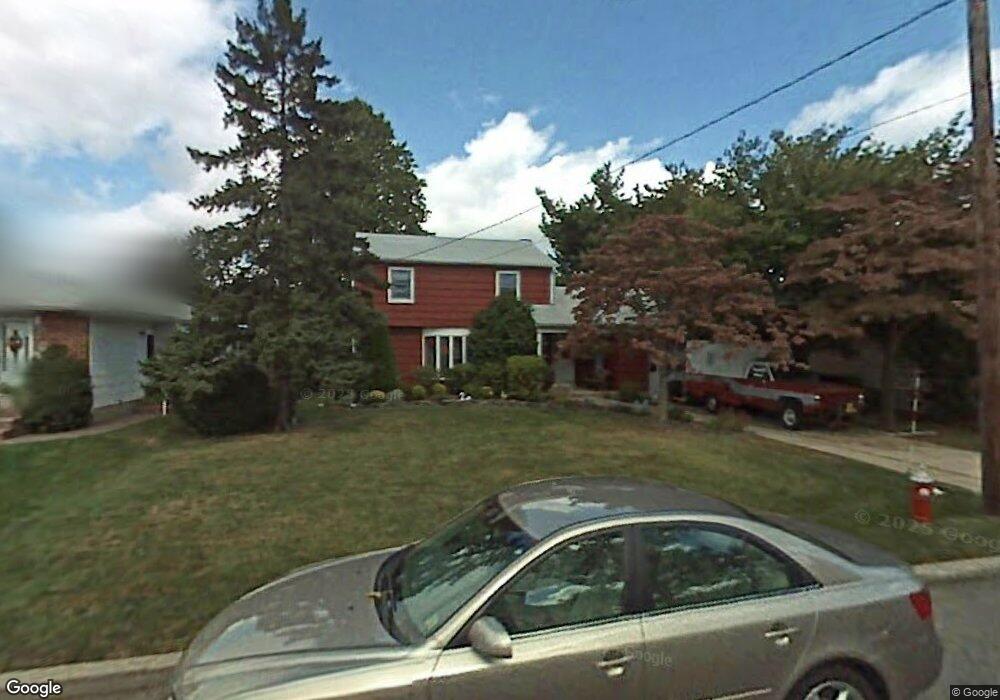
42 Sherman Ave Bethpage, NY 11714
Estimated Value: $819,000 - $838,858
3
Beds
2
Baths
1,645
Sq Ft
$504/Sq Ft
Est. Value
About This Home
This home is located at 42 Sherman Ave, Bethpage, NY 11714 and is currently estimated at $828,929, approximately $503 per square foot. 42 Sherman Ave is a home located in Nassau County with nearby schools including Central Boulevard Elementary School, John F Kennedy Middle School, and Bethpage Senior High School.
Ownership History
Date
Name
Owned For
Owner Type
Purchase Details
Closed on
Jul 4, 2025
Sold by
Whalen Hebert and Whalen Monika
Bought by
Whalen Debra
Current Estimated Value
Purchase Details
Closed on
Jul 3, 2025
Sold by
Malandro John
Bought by
John Malandro Revocable Living Trust and Malandro
Purchase Details
Closed on
Jul 2, 2025
Sold by
Whalen Debra
Bought by
Malandro John
Purchase Details
Closed on
Dec 29, 2017
Sold by
Young Norman and Young Clifford S
Bought by
Young Norman and Young Ckifford S
Home Financials for this Owner
Home Financials are based on the most recent Mortgage that was taken out on this home.
Original Mortgage
$376,000
Interest Rate
3.9%
Mortgage Type
New Conventional
Create a Home Valuation Report for This Property
The Home Valuation Report is an in-depth analysis detailing your home's value as well as a comparison with similar homes in the area
Home Values in the Area
Average Home Value in this Area
Purchase History
We collect this data history from publicly available records. To have your information removed, we recommend requesting removal directly through your county’s website.
| Date | Buyer | Sale Price | Title Company |
|---|---|---|---|
| Whalen Debra | -- | All Ny Title Agency Inc | |
| Whalen Debra | -- | All Ny Title Agency Inc | |
| John Malandro Revocable Living Trust | -- | None Available | |
| John Malandro Revocable Living Trust | -- | None Available | |
| Malandro John | -- | All Ny Title Agency Inc | |
| Malandro John | -- | All Ny Title Agency Inc | |
| Young Norman | $470,000 | All New York Title | |
| Young Norman S | $470,000 | All New York Title | |
| Young Norman | -- | All New York Title | |
| Young Norman S | -- | All New York Title | |
| Young Norman S | $470,000 | All New York Title | |
| Young Norman S | -- | All New York Title |
Source: Public Records
Mortgage History
We collect this data history from publicly available records. To have your information removed, we recommend requesting removal directly through your county’s website.
| Date | Status | Borrower | Loan Amount |
|---|---|---|---|
| Previous Owner | Young Norman S | $376,000 |
Source: Public Records
Tax History
| Year | Tax Paid | Tax Assessment Tax Assessment Total Assessment is a certain percentage of the fair market value that is determined by local assessors to be the total taxable value of land and additions on the property. | Land | Improvement |
|---|---|---|---|---|
| 2025 | $16,079 | $576 | $425 | $151 |
| 2024 | $5,160 | $544 | $398 | $146 |
| 2023 | $15,091 | $581 | $425 | $156 |
| 2022 | $15,091 | $581 | $425 | $156 |
| 2021 | $15,066 | $563 | $412 | $151 |
| 2020 | $14,563 | $783 | $705 | $78 |
| 2019 | $5,022 | $846 | $762 | $84 |
| 2018 | $8,991 | $846 | $0 | $0 |
| 2017 | $5,384 | $846 | $719 | $127 |
| 2016 | $9,732 | $896 | $705 | $191 |
| 2015 | $4,062 | $946 | $745 | $201 |
| 2014 | $4,062 | $946 | $745 | $201 |
| 2013 | $3,747 | $968 | $762 | $206 |
Source: Public Records
Map
Nearby Homes
Your Personal Tour Guide
Ask me questions while you tour the home.