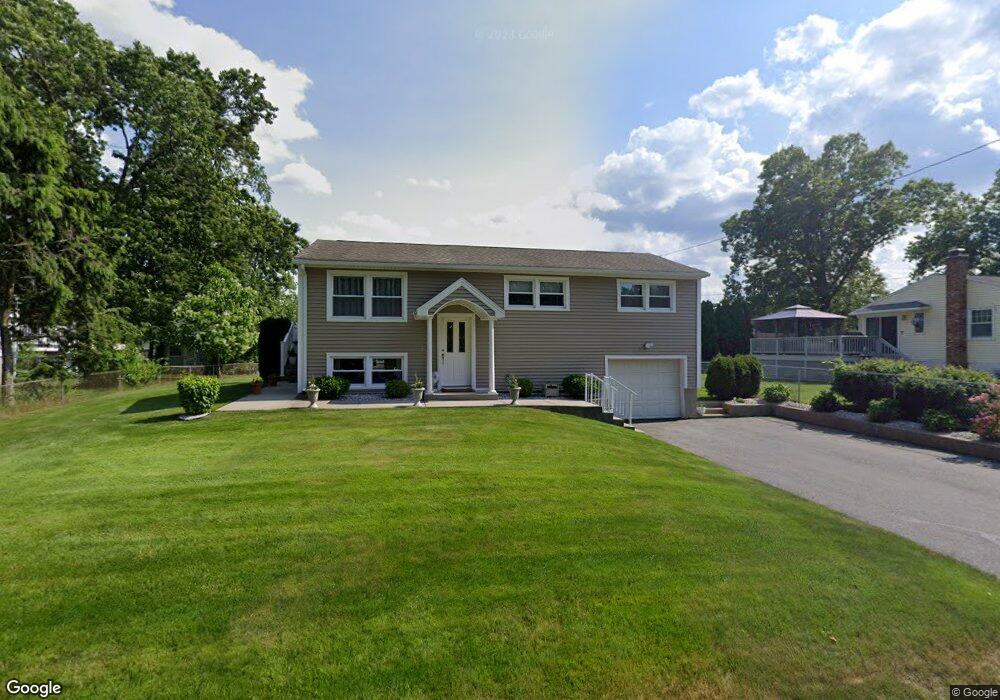
42 Voltage Ave Ludlow, MA 01056
Estimated Value: $266,000 - $360,000
3
Beds
1
Bath
1,632
Sq Ft
$193/Sq Ft
Est. Value
About This Home
This home is located at 42 Voltage Ave, Ludlow, MA 01056 and is currently estimated at $314,670, approximately $192 per square foot. 42 Voltage Ave is a home located in Hampden County with nearby schools including East Street Elementary School, Chapin Street Elementary School, and Paul R. Baird Middle School.
Ownership History
Date
Name
Owned For
Owner Type
Purchase Details
Closed on
Mar 18, 2016
Sold by
Martins Carlos P and Martins Maria F
Bought by
Martins Carlos A and Martins Eugene L
Current Estimated Value
Purchase Details
Closed on
Oct 5, 1979
Bought by
Martins Carlos A and Martins Eugene L
Create a Home Valuation Report for This Property
The Home Valuation Report is an in-depth analysis detailing your home's value as well as a comparison with similar homes in the area
Home Values in the Area
Average Home Value in this Area
Purchase History
| Date | Buyer | Sale Price | Title Company |
|---|---|---|---|
| Martins Carlos A | -- | -- | |
| Martins Carlos A | -- | -- | |
| Martins Carlos A | $38,000 | -- |
Source: Public Records
Mortgage History
| Date | Status | Borrower | Loan Amount |
|---|---|---|---|
| Previous Owner | Martins Carlos A | $100,000 | |
| Previous Owner | Martins Carlos A | $33,000 | |
| Previous Owner | Martins Carlos A | $35,000 |
Source: Public Records
Tax History
| Year | Tax Paid | Tax Assessment Tax Assessment Total Assessment is a certain percentage of the fair market value that is determined by local assessors to be the total taxable value of land and additions on the property. | Land | Improvement |
|---|---|---|---|---|
| 2025 | $3,944 | $227,300 | $85,600 | $141,700 |
| 2024 | $3,860 | $213,400 | $85,600 | $127,800 |
| 2023 | $3,767 | $193,100 | $78,400 | $114,700 |
| 2022 | $3,422 | $171,200 | $71,900 | $99,300 |
| 2021 | $3,485 | $165,300 | $71,900 | $93,400 |
| 2020 | $3,373 | $163,600 | $70,800 | $92,800 |
| 2019 | $3,197 | $161,300 | $70,100 | $91,200 |
| 2018 | $3,028 | $159,300 | $70,100 | $89,200 |
| 2017 | $2,811 | $151,700 | $61,800 | $89,900 |
| 2016 | $2,761 | $152,300 | $60,600 | $91,700 |
| 2015 | $3,000 | $173,500 | $60,000 | $113,500 |
Source: Public Records
Map
Nearby Homes
- 39 Salli Cir
- 229 Miller St Unit F-6
- 229 Miller St Unit D-6
- 80 Elizabeth Dr
- 37 Balsam Hill Rd
- 35 Lake Dr
- 308 Miller St Unit 77
- 308 Miller St Unit 79
- 44 Balsam Hill Rd
- 49 Balsam Hill Rd
- 1 Aspen Dr
- 46 Washington Rd
- 142 Marion Cir
- Lot 28 Tower Rd
- 24 Merrill Rd
- 38 King Dr
- 1252 East St
- 235 James St
- 6 Blueberry Hill Rd
- 128 Williams St
Your Personal Tour Guide
Ask me questions while you tour the home.