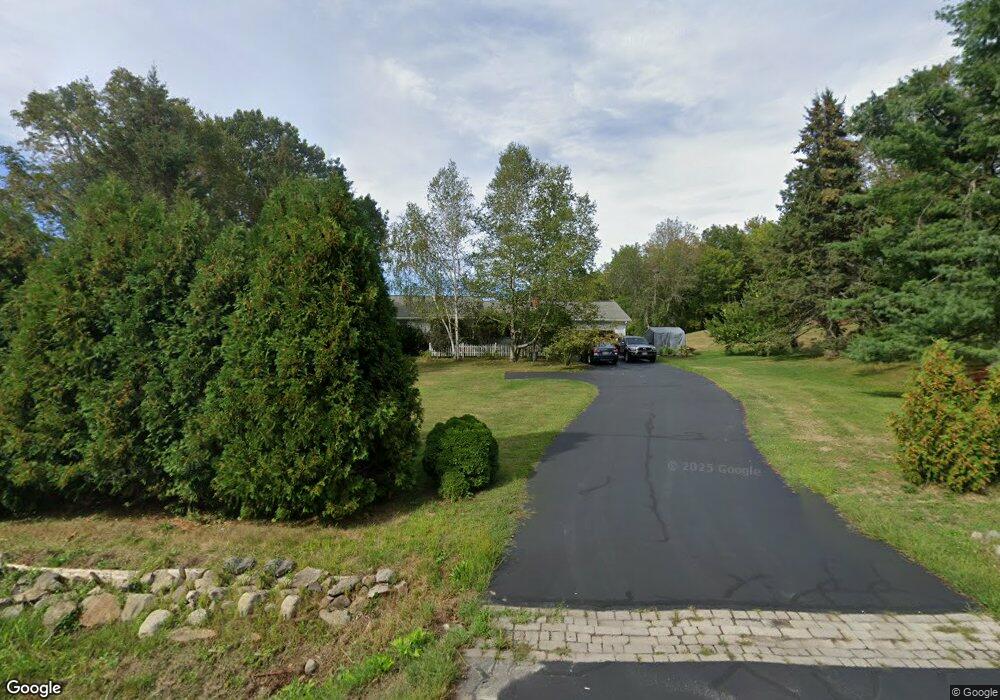
420 South St Biddeford, ME 04005
North Biddeford NeighborhoodEstimated Value: $524,000 - $612,000
2
Beds
2
Baths
1,520
Sq Ft
$365/Sq Ft
Est. Value
About This Home
This home is located at 420 South St, Biddeford, ME 04005 and is currently estimated at $554,870, approximately $365 per square foot. 420 South St is a home located in York County with nearby schools including John F Kennedy Memorial School, Biddeford Primary School, and Biddeford Intermediate School.
Ownership History
Date
Name
Owned For
Owner Type
Purchase Details
Closed on
Mar 24, 2014
Sold by
Flint Katherine E
Bought by
Nevers Joel E and Brown Linda S
Current Estimated Value
Purchase Details
Closed on
Sep 30, 2008
Sold by
Mccallum Sandra L
Bought by
Brown Linda S
Home Financials for this Owner
Home Financials are based on the most recent Mortgage that was taken out on this home.
Original Mortgage
$120,000
Interest Rate
5.94%
Mortgage Type
Stand Alone Second
Create a Home Valuation Report for This Property
The Home Valuation Report is an in-depth analysis detailing your home's value as well as a comparison with similar homes in the area
Home Values in the Area
Average Home Value in this Area
Purchase History
| Date | Buyer | Sale Price | Title Company |
|---|---|---|---|
| Nevers Joel E | -- | -- | |
| Flint Katherine E | -- | -- | |
| Nevers Joel E | -- | -- | |
| Flint Katherine E | -- | -- | |
| Brown Linda S | -- | -- | |
| Nevers Joel E | -- | -- | |
| Brown Linda S | -- | -- | |
| Nevers Joel E | -- | -- |
Source: Public Records
Mortgage History
| Date | Status | Borrower | Loan Amount |
|---|---|---|---|
| Previous Owner | Nevers Joel E | $120,000 |
Source: Public Records
Tax History
| Year | Tax Paid | Tax Assessment Tax Assessment Total Assessment is a certain percentage of the fair market value that is determined by local assessors to be the total taxable value of land and additions on the property. | Land | Improvement |
|---|---|---|---|---|
| 2025 | $6,928 | $463,700 | $209,100 | $254,600 |
| 2024 | $6,524 | $458,800 | $209,100 | $249,700 |
| 2023 | $5,962 | $454,400 | $204,700 | $249,700 |
| 2022 | $5,699 | $347,300 | $116,600 | $230,700 |
| 2021 | $4,756 | $291,900 | $94,300 | $197,600 |
| 2020 | $4,593 | $259,500 | $77,500 | $182,000 |
| 2019 | $5,185 | $259,500 | $77,500 | $182,000 |
| 2018 | $5,112 | $259,500 | $77,500 | $182,000 |
| 2017 | $4,741 | $236,200 | $77,500 | $158,700 |
| 2016 | $3,208 | $236,200 | $77,500 | $158,700 |
| 2015 | $4,248 | $234,200 | $77,500 | $156,700 |
| 2014 | $4,144 | $234,200 | $77,500 | $156,700 |
| 2013 | -- | $298,900 | $131,900 | $167,000 |
Source: Public Records
Map
Nearby Homes
- 24 Remi Dr
- 1 Baxter Blvd
- 4 Baxter Blvd
- 2 Baxter Blvd
- 5 Apostolic Way
- 00 Cottonwood Dr
- 88 May St Unit 101
- 88 May St Unit 102
- 91 Western Ave Unit 3
- 19 Lessard Ave
- 70 Mason St
- 13 Western Ave
- 2 Banks Ln
- 312 Alfred St
- 317 Alfred St Unit 101
- 64 Bradbury St
- 43 New County Rd
- 17 Buzzell Rd
- 611 South St
- 17 Wentworth St
Your Personal Tour Guide
Ask me questions while you tour the home.