
Seller's Agent in 2013
Monte Young
Bellwether Real Estate
(360) 380-0803
46 Total Sales


Estimated Value: $710,000 - $862,000
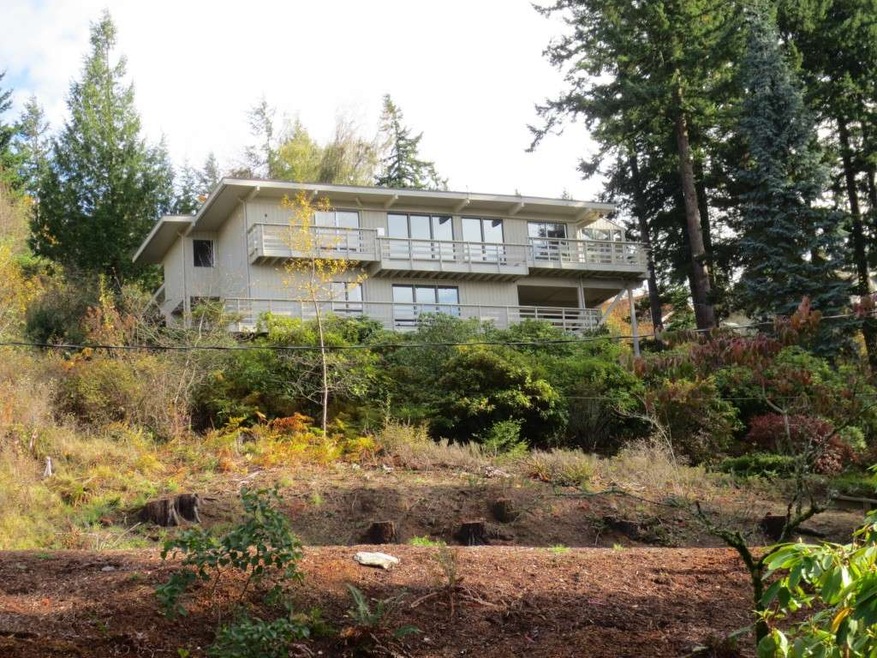
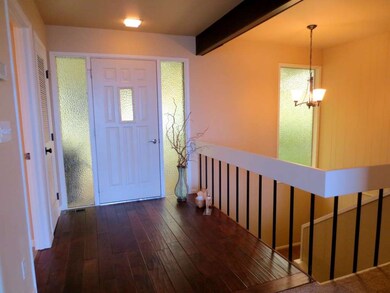
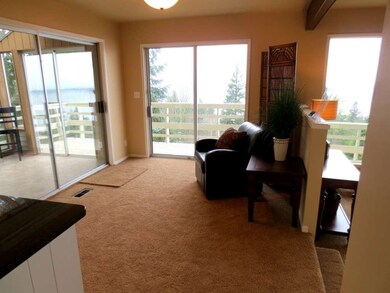
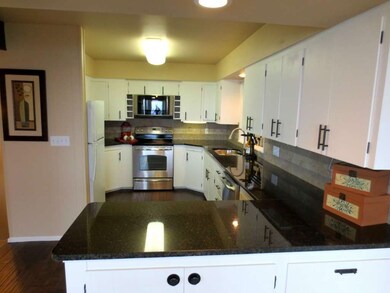
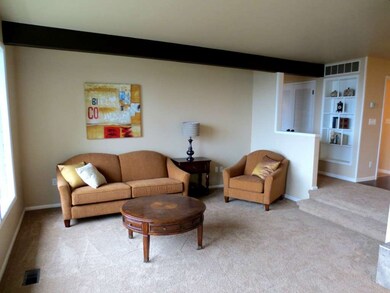
Killer re-vamped house with a dynamic Bay Island and Canadian Mnts view, lots of tile, awesome kitchen with granite & stainless, Hand scraped oak floors, All tile master with soaking tub and All Tile walk in shower, double vanity laiden with Granite & huge walk in closet. New heat pump. Double garage, Artist studio sun room. big family room with fireplace & living room firplace laiden in tile as well. 1/2 Plus acre lot.Very tastfully re-worked! Lots of deck space including 2 covered areas.
Last Agent to Sell the Property
Bellwether Real Estate License #2871 Listed on: 12/11/2012
Last Buyer's Agent
Jerry Campbell
Muljat Group
Source: Northwest Multiple Listing Service (NWMLS)
MLS#: NWM429980
Home Type
Other
Year Built
1968
Lot Details
0.56 Acres
| Date | Buyer | Sale Price | Title Company |
|---|---|---|---|
| Wesley David Scott | $274,280 | Whatcom Land Title |
| Date | Event | Price | List to Sale | Price per Sq Ft |
|---|---|---|---|---|
| 03/20/2013 03/20/13 | Sold | $291,000 | 0.0% | $117 / Sq Ft |
| 02/08/2013 02/08/13 | Pending | -- | -- | -- |
| 12/11/2012 12/11/12 | For Sale | $291,000 | -- | $117 / Sq Ft |
| Year | Tax Paid | Tax Assessment Tax Assessment Total Assessment is a certain percentage of the fair market value that is determined by local assessors to be the total taxable value of land and additions on the property. | Land | Improvement |
|---|---|---|---|---|
| 2025 | $5,653 | $644,315 | $249,628 | $394,687 |
| 2024 | $5,528 | $625,535 | $242,352 | $383,183 |
| 2023 | $5,528 | $653,047 | $253,011 | $400,036 |
| 2022 | $4,389 | $530,932 | $205,700 | $325,232 |
| 2021 | $4,601 | $438,787 | $170,000 | $268,787 |
| 2020 | $4,491 | $432,675 | $155,770 | $276,905 |
| 2019 | $4,010 | $404,263 | $145,650 | $258,613 |
| 2018 | $4,146 | $362,598 | $130,650 | $231,948 |
| 2017 | $3,611 | $320,830 | $115,600 | $205,230 |
| 2016 | $3,337 | $291,587 | $105,200 | $186,387 |
| 2015 | $3,613 | $277,765 | $100,000 | $177,765 |
| 2014 | -- | $292,595 | $123,840 | $168,755 |
| 2013 | -- | $280,681 | $120,000 | $160,681 |
Seller's Agent in 2013
Monte Young
Bellwether Real Estate
(360) 380-0803
46 Total Sales
J
Buyer's Agent in 2013
Jerry Campbell
Muljat Group
Source: Northwest Multiple Listing Service (NWMLS)
MLS Number: NWM429980
APN: 380310-529134-0000
Disclaimer: Certain information contained herein is derived from information provided by parties other than Homes.com. All information provided is deemed reliable, but is not guaranteed to be accurate and should be independently verified.
![]() All data is obtained from various sources and may not have been verified by broker or MLS GRID. Supplied Open House Information is subject to change without notice. All information should be independently reviewed and verified for accuracy. Properties may or may not be listed by the office/agent presenting the information. Listing information is provided by the Northwest Multiple Listing Service (NWMLS). Property information is based on available data that may include MLS information, county records, and other sources. Listings marked with the 3 tree icon and provided by NWMLS. All properties are subject to prior sale or withdrawal. IDX information is provided exclusively for consumers’ personal noncommercial use, that it may not be used for any purpose other than to identify prospective properties consumers may be interested in purchasing, that the data is deemed reliable but is not guaranteed by MLS GRID. ©2026 NWMLS.
All data is obtained from various sources and may not have been verified by broker or MLS GRID. Supplied Open House Information is subject to change without notice. All information should be independently reviewed and verified for accuracy. Properties may or may not be listed by the office/agent presenting the information. Listing information is provided by the Northwest Multiple Listing Service (NWMLS). Property information is based on available data that may include MLS information, county records, and other sources. Listings marked with the 3 tree icon and provided by NWMLS. All properties are subject to prior sale or withdrawal. IDX information is provided exclusively for consumers’ personal noncommercial use, that it may not be used for any purpose other than to identify prospective properties consumers may be interested in purchasing, that the data is deemed reliable but is not guaranteed by MLS GRID. ©2026 NWMLS.
Based on information submitted to the MLS GRID
Ask me questions while you tour the home.