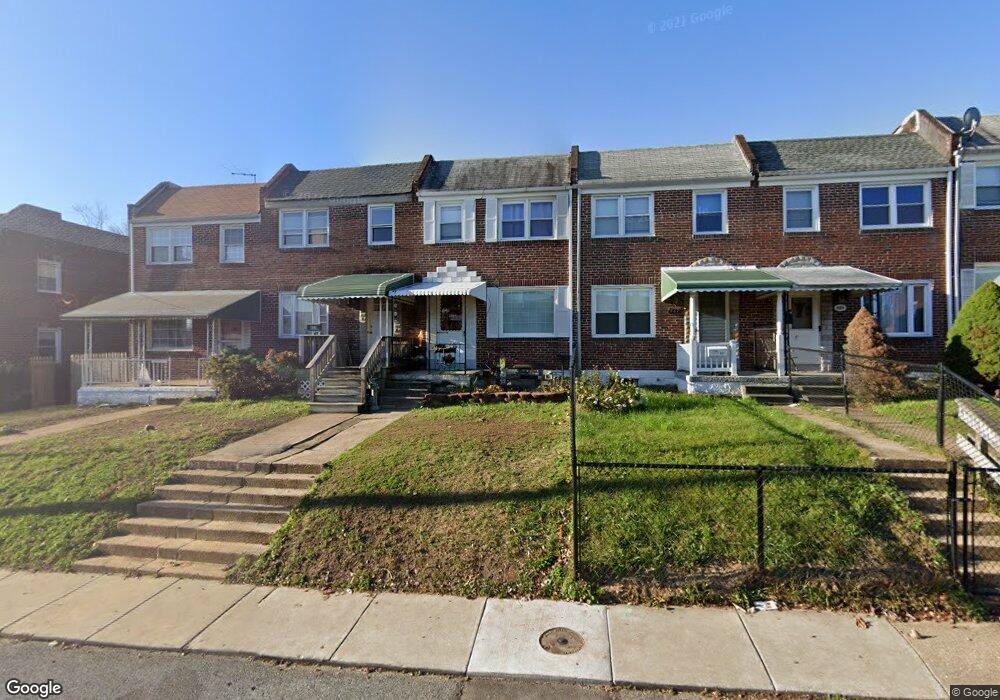
421 5th Ave Brooklyn, MD 21225
Estimated Value: $162,000 - $214,000
Studio
1
Bath
992
Sq Ft
$190/Sq Ft
Est. Value
About This Home
This home is located at 421 5th Ave, Brooklyn, MD 21225 and is currently estimated at $188,888, approximately $190 per square foot. 421 5th Ave is a home located in Anne Arundel County with nearby schools including Belle Grove Elementary School, Brooklyn Park Middle School, and North County High School.
Ownership History
Date
Name
Owned For
Owner Type
Purchase Details
Closed on
Jul 25, 2005
Sold by
Williams Joseph B
Bought by
Sanchez Sergio
Current Estimated Value
Home Financials for this Owner
Home Financials are based on the most recent Mortgage that was taken out on this home.
Original Mortgage
$107,920
Outstanding Balance
$56,917
Interest Rate
5.82%
Mortgage Type
New Conventional
Estimated Equity
$131,971
Purchase Details
Closed on
Aug 24, 1990
Sold by
Patsko Geo A
Bought by
Williams Joseph B
Create a Home Valuation Report for This Property
The Home Valuation Report is an in-depth analysis detailing your home's value as well as a comparison with similar homes in the area
Home Values in the Area
Average Home Value in this Area
Purchase History
| Date | Buyer | Sale Price | Title Company |
|---|---|---|---|
| Sanchez Sergio | $134,900 | -- | |
| Williams Joseph B | $66,000 | -- |
Source: Public Records
Mortgage History
| Date | Status | Borrower | Loan Amount |
|---|---|---|---|
| Open | Sanchez Sergio | $107,920 | |
| Closed | Sanchez Sergio | $26,980 |
Source: Public Records
Tax History
| Year | Tax Paid | Tax Assessment Tax Assessment Total Assessment is a certain percentage of the fair market value that is determined by local assessors to be the total taxable value of land and additions on the property. | Land | Improvement |
|---|---|---|---|---|
| 2025 | $1,883 | $135,300 | $30,000 | $105,300 |
| 2024 | $1,883 | $131,433 | $0 | $0 |
| 2023 | $1,811 | $127,567 | $0 | $0 |
| 2022 | $1,669 | $123,700 | $40,000 | $83,700 |
| 2020 | $1,611 | $122,100 | $0 | $0 |
| 2019 | $1,604 | $121,300 | $40,000 | $81,300 |
| 2018 | $1,211 | $119,400 | $0 | $0 |
| 2017 | $1,529 | $117,500 | $0 | $0 |
| 2016 | -- | $115,600 | $0 | $0 |
| 2015 | -- | $108,133 | $0 | $0 |
| 2014 | -- | $100,667 | $0 | $0 |
Source: Public Records
Map
Nearby Homes
- 215 Grove Park Rd
- 336 Arden Rd W
- 17 2nd Ave
- 201 9th Ave
- 119 W Edgevale Rd
- 5614 Cliff Side Ct
- 113 W Edgevale Rd
- 4106 Ritchie Hwy
- 216 Charles St
- 3916 Potee St
- 6028 A Belle Grove Rd
- 932 1st St
- 3916 2nd St
- 915 1st St
- 944 1st St
- 923 1st St
- 28 Talbott St
- 219 Doris Ave
- 4013 4th St
- Lot 10, 11 W Patapsco Ave
Your Personal Tour Guide
Ask me questions while you tour the home.