Estimated Value: $337,000 - $377,000
About This Home
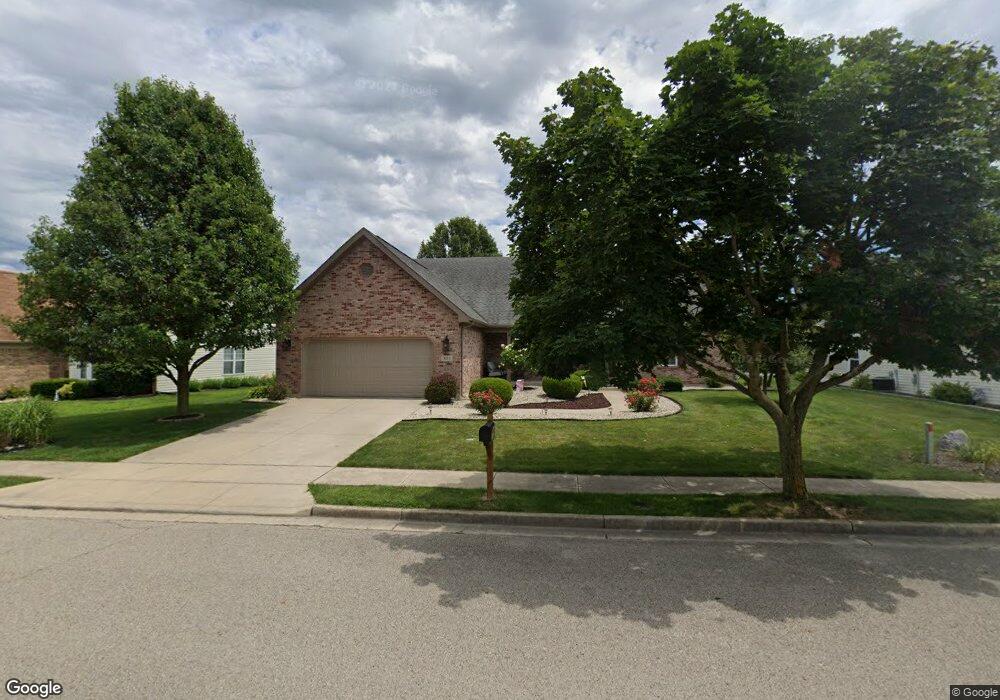
This home is located at 421 Bear Run, Piqua, OH 45356 and is currently estimated at $356,383, approximately $179 per square foot. 421 Bear Run is a home located in Miami County with nearby schools including Washington Primary School, Piqua Junior High School, and Piqua High School.
Ownership History
We collect this data history from publicly available records. To have your information removed, we recommend requesting removal directly through your county’s website.
Purchase Details
Home Financials for this Owner
Home Financials are based on the most recent Mortgage that was taken out on this home.Purchase Details
Home Values in the Area
Average Home Value in this Area
Purchase History
We collect this data history from publicly available records. To have your information removed, we recommend requesting removal directly through your county’s website.
| Date | Buyer | Sale Price | Title Company |
|---|---|---|---|
| $229,000 | None Available | ||
| $200,436 | -- |
Mortgage History
We collect this data history from publicly available records. To have your information removed, we recommend requesting removal directly through your county’s website.
| Date | Status | Borrower | Loan Amount |
|---|---|---|---|
| Previous Owner | $217,550 | ||
| Closed | $0 |
Tax History
We collect this data history from publicly available records. To have your information removed, we recommend requesting removal directly through your county’s website.
| Year | Tax Paid | Tax Assessment Tax Assessment Total Assessment is a certain percentage of the fair market value that is determined by local assessors to be the total taxable value of land and additions on the property. | Land | Improvement |
|---|---|---|---|---|
| 2025 | $4,155 | $117,710 | $11,830 | $105,880 |
| 2024 | $4,155 | $88,070 | $11,380 | $76,690 |
| 2023 | $3,619 | $88,070 | $11,380 | $76,690 |
| 2022 | $3,682 | $88,070 | $11,380 | $76,690 |
| 2021 | $3,502 | $76,590 | $9,910 | $66,680 |
| 2020 | $3,431 | $76,590 | $9,910 | $66,680 |
| 2019 | $3,056 | $76,590 | $9,910 | $66,680 |
| 2018 | $2,675 | $65,460 | $9,910 | $55,550 |
| 2017 | $1,354 | $65,460 | $9,910 | $55,550 |
| 2016 | $2,678 | $65,460 | $9,910 | $55,550 |
| 2015 | $2,741 | $65,460 | $9,910 | $55,550 |
| 2014 | $2,741 | $65,460 | $9,910 | $55,550 |
| 2013 | $2,750 | $65,460 | $9,910 | $55,550 |
Map
- 408 Deerwood Dr
- 0 W High St Unit 1044856
- 804 Lambert Dr
- 808 Lambert Dr
- 1813 Britton Dr
- 1801 Wilshire Dr
- 1814 Carlyle Dr
- 1810 Carlyle Dr
- 14 Osprey Ct
- 9 Eagles Way
- 2 Orchard Dr
- 1515 W High St
- 0 Robert M Davis Pkwy
- 1435 Covington Ave
- 500 Beverly Dr
- 506 Beverly Dr
- 1125 Anderson St
- 000 High St
- 1105 Lenox St
- 1000 Echo Lake Dr
Ask me questions while you tour the home.