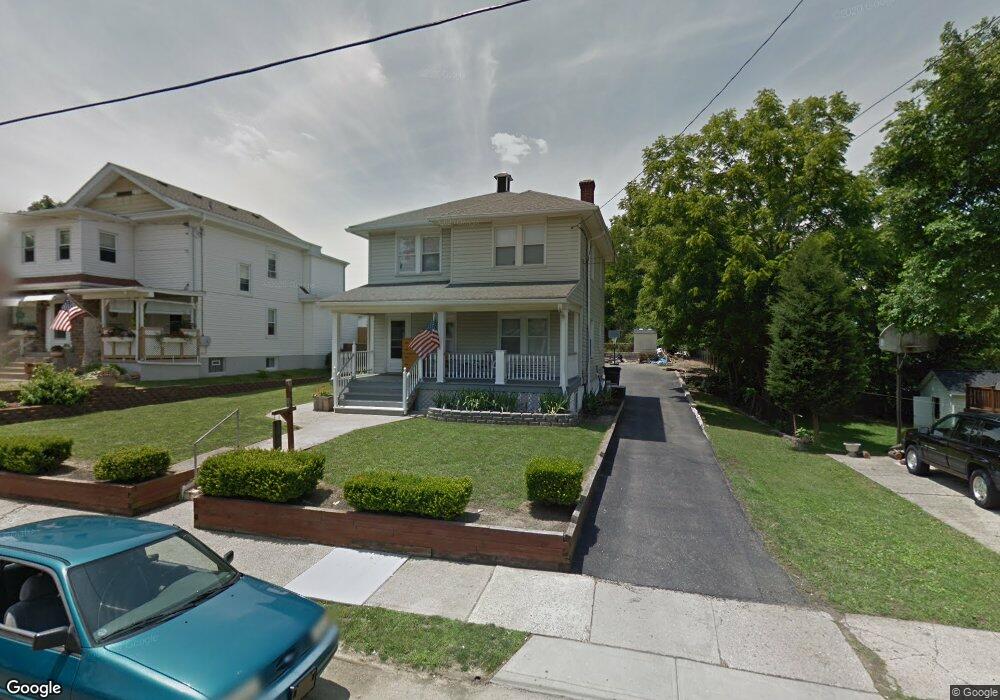
4223 Lowry Ave Cincinnati, OH 45212
Estimated Value: $226,807 - $283,000
3
Beds
2
Baths
2,058
Sq Ft
$120/Sq Ft
Est. Value
About This Home
This home is located at 4223 Lowry Ave, Cincinnati, OH 45212 and is currently estimated at $247,952, approximately $120 per square foot. 4223 Lowry Ave is a home located in Hamilton County with nearby schools including Norwood High School, Cornerstone Christian Academy, and Xavier University Montessori Lab School.
Ownership History
Date
Name
Owned For
Owner Type
Purchase Details
Closed on
Oct 11, 2007
Sold by
Hsbc Mortgage Services Inc
Bought by
Haney William
Current Estimated Value
Home Financials for this Owner
Home Financials are based on the most recent Mortgage that was taken out on this home.
Original Mortgage
$94,900
Outstanding Balance
$58,882
Interest Rate
6.45%
Mortgage Type
Unknown
Estimated Equity
$189,070
Purchase Details
Closed on
Sep 7, 2007
Sold by
Ihmeidan Faris
Bought by
Hsbc Mortgage Services Inc
Home Financials for this Owner
Home Financials are based on the most recent Mortgage that was taken out on this home.
Original Mortgage
$94,900
Outstanding Balance
$58,882
Interest Rate
6.45%
Mortgage Type
Unknown
Estimated Equity
$189,070
Purchase Details
Closed on
Apr 15, 2005
Sold by
Hetz Robert C and Hetz Diane K
Bought by
Ihmeidan Faris
Home Financials for this Owner
Home Financials are based on the most recent Mortgage that was taken out on this home.
Original Mortgage
$124,500
Interest Rate
8.2%
Mortgage Type
Fannie Mae Freddie Mac
Purchase Details
Closed on
Mar 1, 2002
Sold by
Mastin Thomas E and Mastin Asenath M
Bought by
Hetz Robert C and Hetz Diane K
Purchase Details
Closed on
Jun 16, 1994
Sold by
Mellen Joseph P
Bought by
Mastin Thomas E and Mastin Asenath M
Create a Home Valuation Report for This Property
The Home Valuation Report is an in-depth analysis detailing your home's value as well as a comparison with similar homes in the area
Home Values in the Area
Average Home Value in this Area
Purchase History
| Date | Buyer | Sale Price | Title Company |
|---|---|---|---|
| Haney William | $94,900 | Sovereign Title Agency Llc | |
| Hsbc Mortgage Services Inc | $82,000 | None Available | |
| Ihmeidan Faris | $124,500 | Custom Land Title Llc | |
| Hetz Robert C | $87,500 | -- | |
| Mastin Thomas E | -- | -- |
Source: Public Records
Mortgage History
| Date | Status | Borrower | Loan Amount |
|---|---|---|---|
| Open | Haney William | $94,900 | |
| Previous Owner | Ihmeidan Faris | $124,500 |
Source: Public Records
Tax History
| Year | Tax Paid | Tax Assessment Tax Assessment Total Assessment is a certain percentage of the fair market value that is determined by local assessors to be the total taxable value of land and additions on the property. | Land | Improvement |
|---|---|---|---|---|
| 2025 | $2,895 | $55,777 | $15,166 | $40,611 |
| 2024 | $2,812 | $55,777 | $15,166 | $40,611 |
| 2023 | $2,887 | $55,777 | $15,166 | $40,611 |
| 2022 | $2,372 | $38,445 | $10,182 | $28,263 |
| 2021 | $2,295 | $38,445 | $10,182 | $28,263 |
| 2020 | $2,302 | $38,445 | $10,182 | $28,263 |
| 2019 | $2,188 | $33,723 | $8,932 | $24,791 |
| 2018 | $2,191 | $33,723 | $8,932 | $24,791 |
| 2017 | $2,072 | $33,723 | $8,932 | $24,791 |
| 2016 | $2,448 | $30,800 | $8,932 | $21,868 |
| 2015 | $1,928 | $30,800 | $8,932 | $21,868 |
| 2014 | $1,748 | $30,800 | $8,932 | $21,868 |
| 2013 | $1,730 | $30,800 | $8,932 | $21,868 |
Source: Public Records
Map
Nearby Homes
- 4210 Lowry Ave
- 4139 Huston Ave
- 4308 Carter Ave
- 1762 Cleveland Ave
- 1846 Lincoln Ave
- 1841 Mills Ave
- 1701 Sherman Ave
- 1828 Williams Ave
- 1846 Cleveland Ave
- 2010 Hopkins Ave
- 1901 Sherman Ave
- 4108 Montgomery Rd
- 3 Baker Cir
- 4206 Lafayette Ave
- 1819 Maple Ave
- 2043 Lawrence Ave
- 1827 Maple Ave
- 1915 Maple Ave
- 4732 Ridgeway Ave
- 2049 Sherman Ave
- 4231 Lowry Ave
- 1737 Weyer Ave
- 4219 Lowry Ave
- 4237 Lowry Ave
- 1735 Weyer Ave
- 1733 Weyer Ave
- 1751 Weyer Ave
- 4232 Lowry Ave
- 1731 Weyer Ave
- 4211 Lowry Ave
- 1753 Weyer Ave
- 4230 Lowry Ave
- 4303 Lowry Ave
- 4226 Lowry Ave
- 1755 Weyer Ave
- 4224 Lowry Ave
- 4209 1/2 Lowry Ave
- 4305 Lowry Ave
- 1724 Hopkins Ave
- 4222 Lowry Ave
Your Personal Tour Guide
Ask me questions while you tour the home.