Estimated Value: $359,000 - $440,000
3
Beds
2
Baths
1,242
Sq Ft
$312/Sq Ft
Est. Value
About This Home
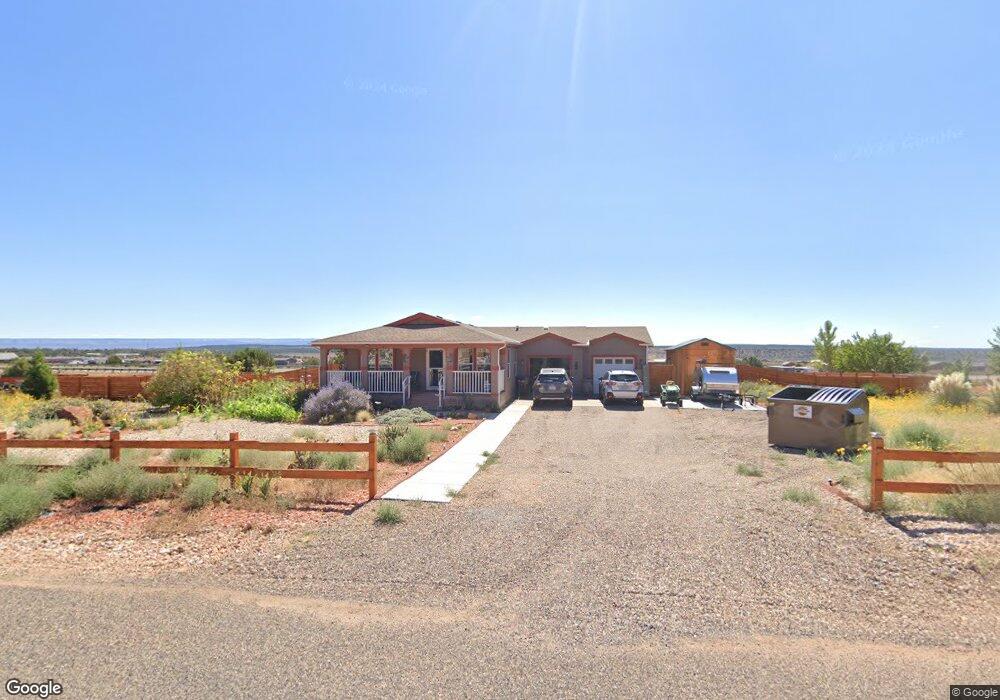
This home is located at 4226 E Juniper Cliffs Dr, Kanab, UT 84741 and is currently estimated at $387,508, approximately $312 per square foot. 4226 E Juniper Cliffs Dr is a home located in Kane County with nearby schools including Kanab Elementary School, Kanab Middle School, and Kanab High School.
Ownership History
Date
Name
Owned For
Owner Type
Purchase Details
Closed on
Jul 1, 2021
Sold by
Windrose West Inc
Bought by
Johnston James
Current Estimated Value
Purchase Details
Closed on
Jan 13, 2020
Sold by
Christopher Lobkovich John
Bought by
Parent Randal Jon and Parent Debra Marie
Purchase Details
Closed on
Mar 16, 2007
Sold by
Garner Wallace Joseph and Garner Georgianne T
Bought by
Kane County
Purchase Details
Closed on
Feb 12, 2007
Sold by
Blake Kimberly
Bought by
Kane County
Purchase Details
Closed on
Jun 21, 2006
Sold by
Blake Kimberly
Bought by
Garner Wallace Joseph and Garner Georgianne T
Purchase Details
Closed on
Aug 2, 2005
Sold by
Blake Terry
Bought by
Blake Kimberly
Create a Home Valuation Report for This Property
The Home Valuation Report is an in-depth analysis detailing your home's value as well as a comparison with similar homes in the area
Purchase History
| Date | Buyer | Sale Price | Title Company |
|---|---|---|---|
| Johnston James | -- | -- | |
| Parent Randal Jon | -- | -- | |
| Kane County | -- | -- | |
| Kane County | -- | -- | |
| Garner Wallace Joseph | -- | -- | |
| Blake Kimberly | -- | -- | |
| Blake Terry | -- | -- |
Source: Public Records
Tax History
| Year | Tax Paid | Tax Assessment Tax Assessment Total Assessment is a certain percentage of the fair market value that is determined by local assessors to be the total taxable value of land and additions on the property. | Land | Improvement |
|---|---|---|---|---|
| 2025 | $2,269 | $329,840 | $119,191 | $210,649 |
| 2024 | $2,378 | $188,419 | $65,556 | $122,863 |
| 2023 | $1,937 | $163,086 | $60,700 | $102,386 |
| 2022 | $1,900 | $141,547 | $39,161 | $102,386 |
| 2021 | $950 | $193,176 | $54,285 | $138,891 |
| 2020 | $947 | $185,964 | $56,347 | $129,617 |
| 2019 | $974 | $185,964 | $56,347 | $129,617 |
| 2018 | $869 | $164,486 | $46,956 | $117,530 |
| 2017 | $757 | $137,100 | $36,120 | $100,980 |
| 2016 | $713 | $125,636 | $30,100 | $95,536 |
| 2015 | $691 | $125,204 | $30,100 | $95,104 |
| 2014 | $691 | $121,464 | $39,123 | $82,341 |
| 2013 | -- | $66,806 | $0 | $0 |
Source: Public Records
Map
Nearby Homes
- 1286 S Knoll
- 1286 S Knoll Unit 6-191
- 4395 E Mountain View Dr Unit C-77
- Lot 10 Silver Dawn Cir
- 3976 Juniper Cliffs Dr
- 4441 Red Cliffs Dr
- 4225 Blue Sky
- 3770 E Juniper Cliffs Dr
- Lot 30 Mule Deer Cir
- 4377 E Colt Cir
- 4377/4375 E Colt Cir
- 4210 Star Gazer Cir
- 4225 E Star Gazer Cir
- 47 Sego Lilly Cir
- 4380 E Sego Lily Cir
- 4210 E Milky Way Cir
- 51 Milky Way Cir
- 50 Milky Way
- 51 Milky Way
- 4960 E Grand Vermillion
- 4196 E Juniper Cliffs Dr
- 4246 Juniper Cliffs Dr
- 4250 Juniper Cliffs Dr
- 4202 E Juniper Cliffs Dr
- 4245 E Juniper Cliffs Dr
- 4276 E Juniper Cliffs Dr
- 4160 E Juniper Cliffs Dr
- 4204 E Mountain View Dr
- 4215 E Mountain View Dr
- 1211 S Pine Cliffs Dr
- 4235 E Mountain View Dr
- 4295 E Juniper Cliffs Dr
- 1305 Butte Ave
- 1305 S Knoll
- 1290 S Butte Ave
- 4310 E Juniper Cliffs Dr
- 4356 Juniper Cliffs Dr
- 1286 S Knoll Unit 191
- 4155 E Mountain View Dr
- 4325 E Mountain View Dr
Your Personal Tour Guide
Ask me questions while you tour the home.