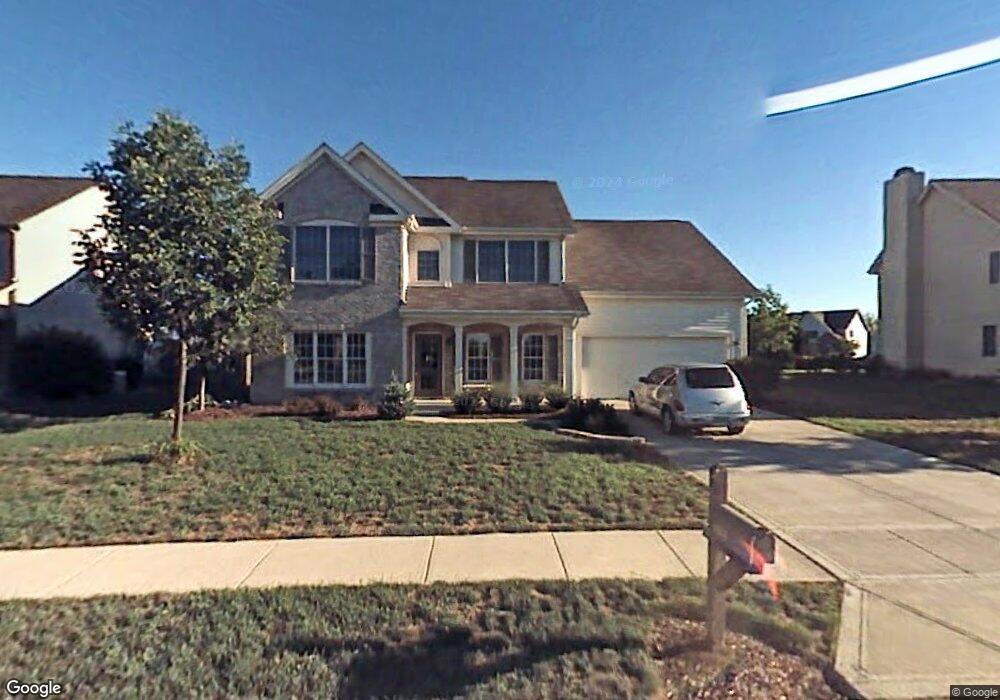
4226 Shine Ct Carmel, IN 46033
East Westfield NeighborhoodEstimated Value: $411,702 - $443,000
3
Beds
3
Baths
2,302
Sq Ft
$188/Sq Ft
Est. Value
About This Home
This home is located at 4226 Shine Ct, Carmel, IN 46033 and is currently estimated at $432,676, approximately $187 per square foot. 4226 Shine Ct is a home located in Hamilton County with nearby schools including Carey Ridge Elementary School, Westfield Intermediate School, and Westfield Middle School.
Ownership History
Date
Name
Owned For
Owner Type
Purchase Details
Closed on
Mar 18, 2019
Sold by
Sohlink Kimberly K
Bought by
Schlink James D
Current Estimated Value
Purchase Details
Closed on
Dec 13, 2002
Sold by
Schlink Kimberly K
Bought by
Schlink James D and Schlink Kimberly K
Home Financials for this Owner
Home Financials are based on the most recent Mortgage that was taken out on this home.
Original Mortgage
$160,000
Interest Rate
6.23%
Mortgage Type
New Conventional
Create a Home Valuation Report for This Property
The Home Valuation Report is an in-depth analysis detailing your home's value as well as a comparison with similar homes in the area
Home Values in the Area
Average Home Value in this Area
Purchase History
| Date | Buyer | Sale Price | Title Company |
|---|---|---|---|
| Schlink James D | -- | None Available | |
| Schlink James D | -- | -- |
Source: Public Records
Mortgage History
| Date | Status | Borrower | Loan Amount |
|---|---|---|---|
| Closed | Schlink James D | $160,000 |
Source: Public Records
Tax History
| Year | Tax Paid | Tax Assessment Tax Assessment Total Assessment is a certain percentage of the fair market value that is determined by local assessors to be the total taxable value of land and additions on the property. | Land | Improvement |
|---|---|---|---|---|
| 2025 | $3,623 | $342,200 | $85,000 | $257,200 |
| 2024 | $3,509 | $322,200 | $65,200 | $257,000 |
| 2023 | $3,509 | $310,400 | $65,200 | $245,200 |
| 2022 | $3,146 | $273,700 | $65,200 | $208,500 |
| 2021 | $2,843 | $241,500 | $65,200 | $176,300 |
| 2020 | $2,802 | $230,800 | $65,200 | $165,600 |
| 2019 | $2,685 | $226,600 | $49,900 | $176,700 |
| 2018 | $2,602 | $219,800 | $49,900 | $169,900 |
| 2017 | $2,275 | $207,000 | $49,900 | $157,100 |
| 2016 | $2,188 | $199,300 | $49,900 | $149,400 |
| 2014 | $2,114 | $190,400 | $46,300 | $144,100 |
| 2013 | $2,114 | $184,800 | $46,300 | $138,500 |
Source: Public Records
Map
Nearby Homes
- 14927 W Black Wolf Run Dr
- 14933 W Black Wolf Run Dr
- 4030 Birkdale Dr
- 3755 Brasseur Ln
- 3965 Pete Dye Blvd
- 1490 Warwick Ct
- 14340 Sydney Ln
- 14980 Oak Hollow Ln E
- 14311 Devonport Dr
- 15055 N Gray Rd
- 14991 Oak Hollow Ln W
- 15363 Mystic Rock Dr
- 15340 Mystic Rock Dr
- 15462 Mission Hills Dr
- 15374 Mystic Rock Dr
- 15519 Hidden Oaks Ln
- 15407 Mystic Rock Dr
- 14649 N Meadowcreek Dr
- 16405 Carey Rd
- 15437 Mystic Rock Dr
Your Personal Tour Guide
Ask me questions while you tour the home.