4228 Langley Ave Cincinnati, OH 45217
Estimated Value: $172,000 - $234,000
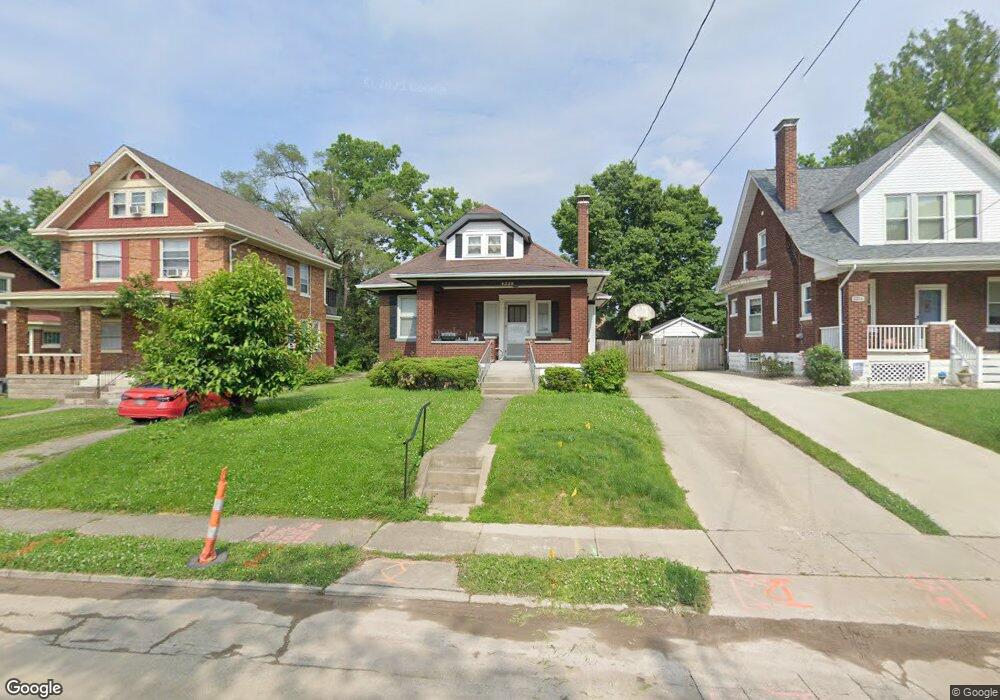
About This Home
This home is located at 4228 Langley Ave, Cincinnati, OH 45217 and is currently estimated at $209,408, approximately $159 per square foot. 4228 Langley Ave is a home located in Hamilton County with nearby schools including St Bernard Elementary School, St Bernard-Elmwood Place High School, and The New School.
Ownership History
We collect this data history from publicly available records. To have your information removed, we recommend requesting removal directly through your county’s website.
Purchase Details
Purchase Details
Purchase Details
Purchase Details
Home Financials for this Owner
Home Financials are based on the most recent Mortgage that was taken out on this home.Home Values in the Area
Average Home Value in this Area
Purchase History
We collect this data history from publicly available records. To have your information removed, we recommend requesting removal directly through your county’s website.
| Date | Buyer | Sale Price | Title Company |
|---|---|---|---|
| $47,100 | -- | ||
| -- | Attorney | ||
| $44,000 | None Available | ||
| $88,500 | -- |
Mortgage History
We collect this data history from publicly available records. To have your information removed, we recommend requesting removal directly through your county’s website.
| Date | Status | Borrower | Loan Amount |
|---|---|---|---|
| Previous Owner | $87,072 |
Tax History
We collect this data history from publicly available records. To have your information removed, we recommend requesting removal directly through your county’s website.
| Year | Tax Paid | Tax Assessment Tax Assessment Total Assessment is a certain percentage of the fair market value that is determined by local assessors to be the total taxable value of land and additions on the property. | Land | Improvement |
|---|---|---|---|---|
| 2025 | $3,095 | $50,358 | $11,340 | $39,018 |
| 2023 | $3,094 | $50,358 | $11,340 | $39,018 |
| 2022 | $1,583 | $19,289 | $8,845 | $10,444 |
| 2021 | $1,577 | $19,289 | $8,845 | $10,444 |
| 2020 | $1,519 | $19,289 | $8,845 | $10,444 |
| 2019 | $1,420 | $16,485 | $7,560 | $8,925 |
| 2018 | $1,441 | $16,485 | $7,560 | $8,925 |
| 2017 | $2,189 | $26,660 | $7,560 | $19,100 |
| 2016 | $1,761 | $21,249 | $8,904 | $12,345 |
| 2015 | $1,638 | $21,249 | $8,904 | $12,345 |
| 2014 | $1,634 | $21,249 | $8,904 | $12,345 |
| 2013 | $1,595 | $22,369 | $9,373 | $12,996 |
Map
- 4232 Langley Ave
- 318 E Mitchell Ave
- 4315 Sullivan Ave
- 3954 Glencross Ave
- 549 Church St
- 3936 Dickson Ave
- 130 Mary Ln
- 3955 Ardmore Ave
- 191 Sturgis Ave
- 3931 Leyman Dr
- 4616 Sullivan Ave
- 4238 Leonard Ave
- 64 E Mitchell Ave
- 313 Washington Ave
- 4504 Park Place
- 37 Orchard St
- 128 Clinton Springs Ave
- 4500 Park Place
- 54 E Mitchell Ave
- 3940 Red Bud Ave
- 4232 Langley Ave Unit 1
- 4236 Langley Ave
- 4216 Langley Ave
- 4238 Langley Ave
- 4233 Greenlee Ave
- 4229 Greenlee Ave
- 4227 Greenlee Ave
- 4235 Greenlee Ave
- 4212 Langley Ave
- 4240 Langley Ave
- 4237 Greenlee Ave
- 4233 Langley Ave
- 4223 Greenlee Ave
- 4225 Langley Ave
- 4235 Langley Ave
- 4239 Greenlee Ave
- 4221 Langley Ave
- 4239 Langley Ave
- 4210 Langley Ave
- 4242 Langley Ave
Ask me questions while you tour the home.