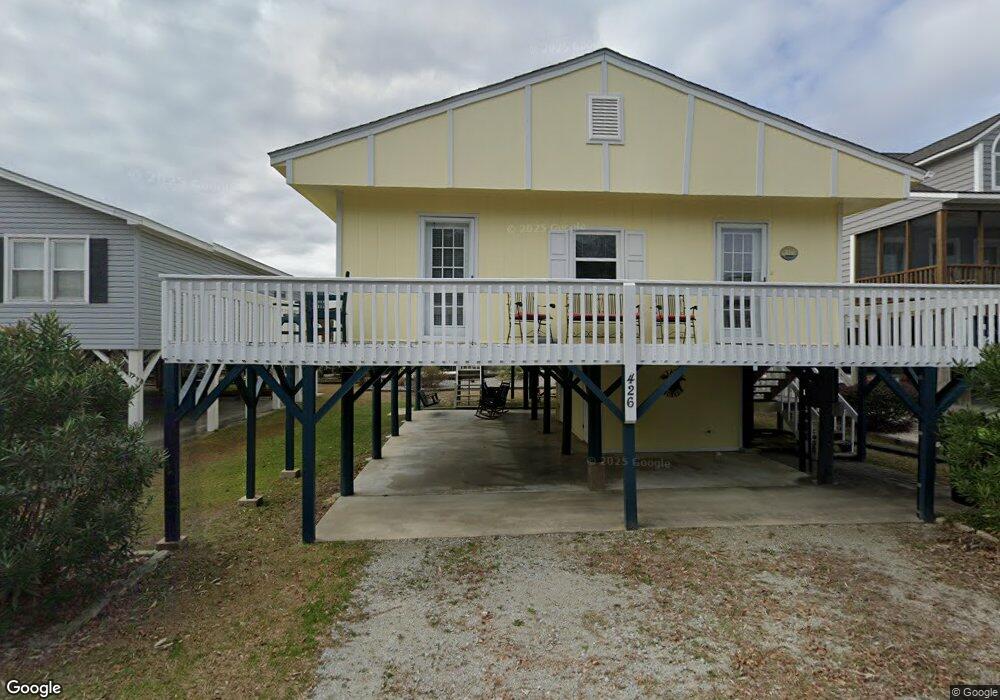
426 32nd St Sunset Beach, NC 28468
Estimated Value: $538,000 - $713,000
3
Beds
1
Bath
1,008
Sq Ft
$602/Sq Ft
Est. Value
About This Home
This home is located at 426 32nd St, Sunset Beach, NC 28468 and is currently estimated at $607,064, approximately $602 per square foot. 426 32nd St is a home located in Brunswick County with nearby schools including Jessie Mae Monroe Elementary School, Shallotte Middle School, and West Brunswick High School.
Ownership History
Date
Name
Owned For
Owner Type
Purchase Details
Closed on
Mar 10, 2015
Sold by
Keever Leonard T and Keever Catherine B
Bought by
Bailey Robert H and Bailey Dolores T
Current Estimated Value
Purchase Details
Closed on
Mar 6, 2015
Sold by
Keever Joseph F and Keever Brenda B
Bought by
Bailey Robert H and Bailey Dolores T
Purchase Details
Closed on
Nov 29, 2013
Sold by
Keever Megan Brittany and Keever Adam Michael
Bought by
Keever Joseph F and Keever Leonard T
Create a Home Valuation Report for This Property
The Home Valuation Report is an in-depth analysis detailing your home's value as well as a comparison with similar homes in the area
Home Values in the Area
Average Home Value in this Area
Purchase History
| Date | Buyer | Sale Price | Title Company |
|---|---|---|---|
| Bailey Robert H | -- | None Available | |
| Bailey Robert H | $200,000 | None Available | |
| Keever Joseph F | -- | None Available |
Source: Public Records
Tax History
| Year | Tax Paid | Tax Assessment Tax Assessment Total Assessment is a certain percentage of the fair market value that is determined by local assessors to be the total taxable value of land and additions on the property. | Land | Improvement |
|---|---|---|---|---|
| 2025 | -- | $483,570 | $240,000 | $243,570 |
| 2024 | $27 | $483,570 | $240,000 | $243,570 |
| 2023 | $1,749 | $483,570 | $240,000 | $243,570 |
| 2022 | $1,749 | $236,280 | $127,500 | $108,780 |
| 2021 | $1,749 | $236,280 | $127,500 | $108,780 |
| 2020 | $1,749 | $236,280 | $127,500 | $108,780 |
| 2019 | $1,749 | $127,500 | $127,500 | $0 |
| 2018 | $1,646 | $225,820 | $130,000 | $95,820 |
| 2017 | $1,612 | $130,000 | $130,000 | $0 |
| 2016 | $1,587 | $130,000 | $130,000 | $0 |
| 2015 | $1,557 | $225,820 | $130,000 | $95,820 |
| 2014 | $2,247 | $392,090 | $330,000 | $62,090 |
Source: Public Records
Map
Nearby Homes
Your Personal Tour Guide
Ask me questions while you tour the home.