Estimated Value: $383,369 - $421,000
2
Beds
1
Bath
2,160
Sq Ft
$188/Sq Ft
Est. Value
About This Home
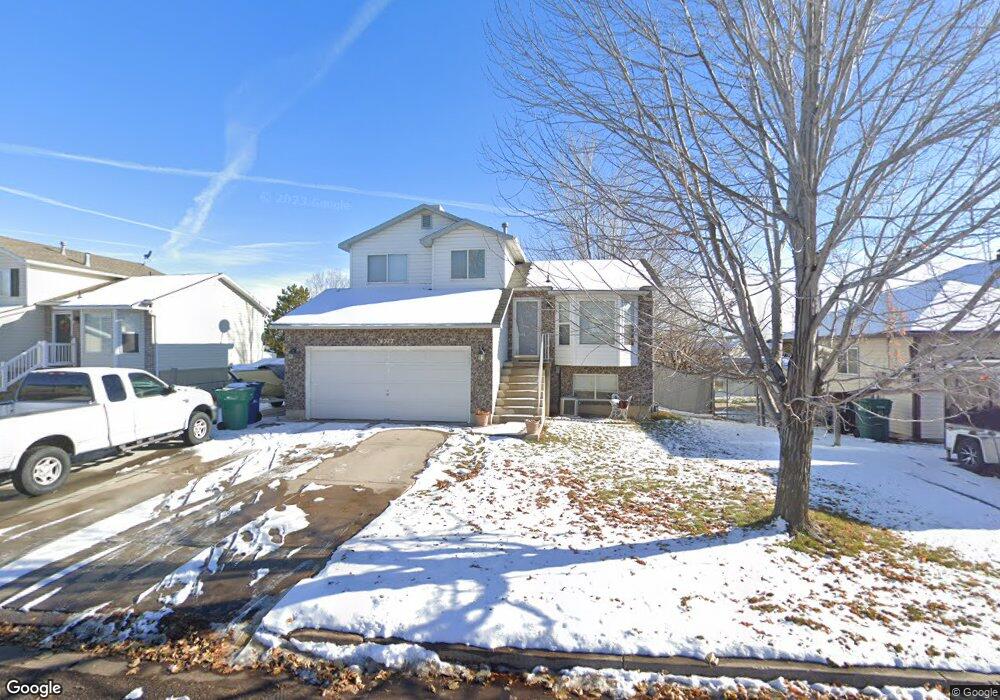
This home is located at 4277 W 5050 S, Roy, UT 84067 and is currently estimated at $406,092, approximately $188 per square foot. 4277 W 5050 S is a home located in Weber County with nearby schools including Country View School, Rocky Mountain Junior High School, and Bridge Elementary School.
Ownership History
Date
Name
Owned For
Owner Type
Purchase Details
Closed on
May 3, 2004
Sold by
Hart Robert J
Bought by
Christensen Curtis and Christensen Melissa
Current Estimated Value
Create a Home Valuation Report for This Property
The Home Valuation Report is an in-depth analysis detailing your home's value as well as a comparison with similar homes in the area
Home Values in the Area
Average Home Value in this Area
Purchase History
We collect this data history from publicly available records. To have your information removed, we recommend requesting removal directly through your county’s website.
| Date | Buyer | Sale Price | Title Company |
|---|---|---|---|
| Christensen Curtis | -- | Bonneville Title |
Source: Public Records
Tax History
| Year | Tax Paid | Tax Assessment Tax Assessment Total Assessment is a certain percentage of the fair market value that is determined by local assessors to be the total taxable value of land and additions on the property. | Land | Improvement |
|---|---|---|---|---|
| 2025 | $2,289 | $357,077 | $121,150 | $235,927 |
| 2024 | $2,234 | $193,049 | $66,454 | $126,595 |
| 2023 | $2,324 | $202,950 | $64,812 | $138,138 |
| 2022 | $2,401 | $216,700 | $56,357 | $160,343 |
| 2021 | $1,931 | $285,000 | $78,065 | $206,935 |
| 2020 | $1,947 | $266,000 | $78,065 | $187,935 |
| 2019 | $1,806 | $231,000 | $43,480 | $187,520 |
| 2018 | $1,692 | $203,000 | $39,543 | $163,457 |
| 2017 | $1,478 | $164,000 | $39,543 | $124,457 |
| 2016 | $1,455 | $86,996 | $21,370 | $65,626 |
| 2015 | $1,252 | $75,984 | $21,370 | $54,614 |
| 2014 | $1,027 | $72,397 | $17,884 | $54,513 |
Source: Public Records
Map
Nearby Homes
Your Personal Tour Guide
Ask me questions while you tour the home.