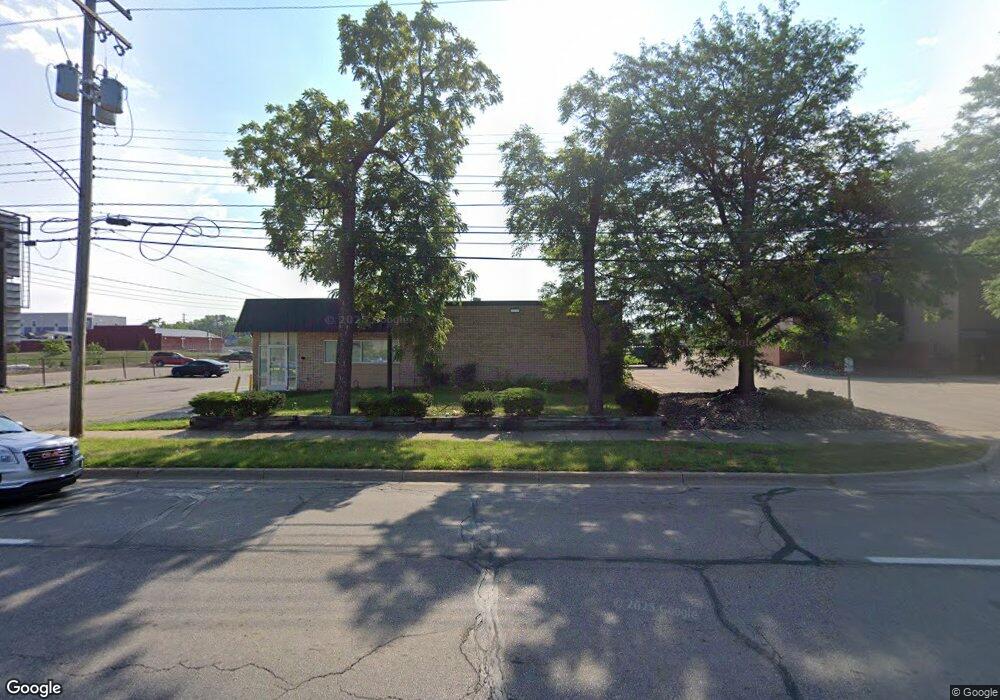
428 N Cedar St Lansing, MI 48912
The Stadium District Neighborhood
Studio
--
Bath
5,662
Sq Ft
21,780
Sq Ft Lot
About This Home
This home is located at 428 N Cedar St, Lansing, MI 48912. 428 N Cedar St is a home located in Ingham County with nearby schools including Pattengill Academy, Riddle Elementary School, and Eastern High School.
Ownership History
Date
Name
Owned For
Owner Type
Purchase Details
Closed on
Feb 8, 2023
Sold by
Castriciano Holdings Llc
Bought by
Teas Real Estate Holdings Llc
Home Financials for this Owner
Home Financials are based on the most recent Mortgage that was taken out on this home.
Original Mortgage
$708,000
Outstanding Balance
$364,872
Interest Rate
5.14%
Mortgage Type
Credit Line Revolving
Purchase Details
Closed on
Jul 24, 2019
Sold by
Castriciano Sostine and Castriciano Filomena
Bought by
Catriciano Holdings Llc
Purchase Details
Closed on
Jan 1, 2002
Sold by
Castriciano Sostine and Castriciano Filomena
Bought by
Castriciano Holdings Llc
Create a Home Valuation Report for This Property
The Home Valuation Report is an in-depth analysis detailing your home's value as well as a comparison with similar homes in the area
Home Values in the Area
Average Home Value in this Area
Purchase History
| Date | Buyer | Sale Price | Title Company |
|---|---|---|---|
| Teas Real Estate Holdings Llc | $630,000 | -- | |
| Catriciano Holdings Llc | -- | None Available | |
| Castriciano Holdings Llc | -- | -- |
Source: Public Records
Mortgage History
| Date | Status | Borrower | Loan Amount |
|---|---|---|---|
| Open | Teas Real Estate Holdings Llc | $708,000 |
Source: Public Records
Tax History
| Year | Tax Paid | Tax Assessment Tax Assessment Total Assessment is a certain percentage of the fair market value that is determined by local assessors to be the total taxable value of land and additions on the property. | Land | Improvement |
|---|---|---|---|---|
| 2025 | $17,681 | $261,500 | $54,800 | $206,700 |
| 2024 | $151 | $229,500 | $54,800 | $174,700 |
| 2023 | $16,617 | $238,100 | $54,800 | $183,300 |
| 2022 | $14,724 | $199,300 | $13,000 | $186,300 |
| 2021 | $12,121 | $156,500 | $13,000 | $143,500 |
| 2020 | $9,881 | $126,100 | $13,000 | $113,100 |
| 2019 | $14,574 | $132,200 | $13,000 | $119,200 |
| 2018 | $8,059 | $124,200 | $13,000 | $111,200 |
| 2017 | $7,771 | $124,200 | $13,000 | $111,200 |
| 2016 | $13,066 | $118,600 | $13,000 | $105,600 |
| 2015 | $13,066 | $113,200 | $25,926 | $87,274 |
| 2014 | $13,066 | $105,300 | $25,926 | $79,374 |
Source: Public Records
Map
Nearby Homes
- 0 S M 43 Hwy
- 322 Pere Marquette Dr Unit 15
- 433 Dorrance Place
- 1 N Grand Ave
- 831 Vine St
- 910 Vine St
- 925 May St
- 207 S Hosmer St
- 209 S Hosmer St
- 309 W Lapeer St
- 1036 N Larch St
- 908 N Capitol Ave
- 514 N Walnut St
- 312 W Saginaw St Unit 1
- 1054 N Cedar St
- 612 N Walnut St
- 920 N Capitol Ave Unit 1
- 615 E Kalamazoo St
- 1035 May St
- 809 Seymour Ave
- 428 N Cedar St
- 505 E Shiawassee St
- 515 N Larch St
- 601 N Cedar St
- 538 N Cedar St
- 312 N Cedar St
- 312 N Cedar St
- 313 N Cedar St
- 313 N Cedar St
- 0 Sunnydale Lot 44
- 400 E Saginaw St
- 400 E Saginaw St
- 322 Pere Unit 4
- 322 Pere Unit 5
- 322 Pere Unit 15
- 322 Pere Unit 8
- 322 Pere Unit 10
- 322 Pere
- 237 Pere Marquette Dr
- 322 Pere Marquette Dr
Your Personal Tour Guide
Ask me questions while you tour the home.