Estimated Value: $389,000 - $449,000
3
Beds
2
Baths
2,320
Sq Ft
$179/Sq Ft
Est. Value
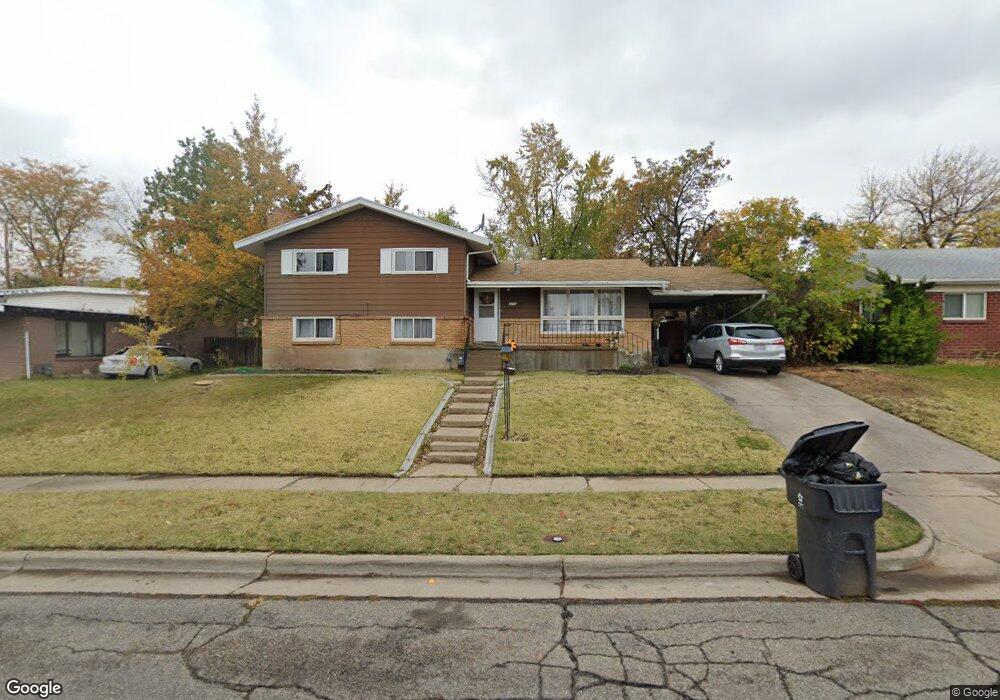
About This Home
This home is located at 4286 S 900 E, Ogden, UT 84403 and is currently estimated at $414,731, approximately $178 per square foot. 4286 S 900 E is a home located in Weber County with nearby schools including Burch Creek School, South Ogden Junior High School, and Bonneville High School.
Ownership History
Date
Name
Owned For
Owner Type
Purchase Details
Closed on
May 11, 2023
Sold by
Johnson Christifer M
Bought by
J & B R E Ventures Llc
Current Estimated Value
Purchase Details
Closed on
Mar 29, 2018
Sold by
Double J Capital Llc
Bought by
Johnson Chrisrifer M
Purchase Details
Closed on
Mar 27, 2018
Sold by
Johnson Brothers Properties Llc
Bought by
Johnson Christifer M and Double J Capital Llc
Purchase Details
Closed on
Oct 19, 2011
Sold by
Johnson Christifer M and Johnson Gregry S
Bought by
Johnson Brothers Properties Llc
Purchase Details
Closed on
Aug 21, 2007
Sold by
Timberlake Investments Llc
Bought by
Johnson Christifer M and Johnson Gregry S
Purchase Details
Closed on
Aug 16, 2007
Sold by
Smith Lawrence David
Bought by
Timberlake Investments Llc
Purchase Details
Closed on
Aug 15, 2007
Sold by
Smith Michael Gordon and Smith Michael G
Bought by
Timberlake Investments Llc
Purchase Details
Closed on
Jun 10, 2004
Sold by
Smith Michael Gordon
Bought by
Smith Michael Gordon and Smith Lawrence David
Create a Home Valuation Report for This Property
The Home Valuation Report is an in-depth analysis detailing your home's value as well as a comparison with similar homes in the area
Home Values in the Area
Average Home Value in this Area
Purchase History
| Date | Buyer | Sale Price | Title Company |
|---|---|---|---|
| J & B R E Ventures Llc | -- | None Listed On Document | |
| Johnson Chrisrifer M | -- | Mountain View Title | |
| Johnson Christifer M | -- | Mountain View Title | |
| Johnson Christifer M | -- | Mountain View Title | |
| Johnson Brothers Properties Llc | -- | Mountain View Title Ogden | |
| Johnson Christifer M | -- | None Available | |
| Timberlake Investments Llc | -- | Mountain View Title Ogden | |
| Timberlake Investments Llc | -- | Mountain View Title Ogden | |
| Smith Michael Gordon | -- | -- |
Source: Public Records
Tax History
| Year | Tax Paid | Tax Assessment Tax Assessment Total Assessment is a certain percentage of the fair market value that is determined by local assessors to be the total taxable value of land and additions on the property. | Land | Improvement |
|---|---|---|---|---|
| 2025 | $2,770 | $385,261 | $111,403 | $273,858 |
| 2024 | $2,649 | $376,000 | $111,403 | $264,597 |
| 2023 | $2,517 | $358,000 | $110,395 | $247,605 |
| 2022 | $2,350 | $343,000 | $101,099 | $241,901 |
| 2021 | $2,005 | $268,000 | $60,825 | $207,175 |
| 2020 | $1,883 | $234,000 | $45,621 | $188,379 |
| 2019 | $1,775 | $209,000 | $35,009 | $173,991 |
| 2018 | $1,694 | $189,000 | $35,009 | $153,991 |
| 2017 | $1,510 | $159,000 | $35,009 | $123,991 |
| 2016 | $1,348 | $77,854 | $19,423 | $58,431 |
| 2015 | $1,319 | $74,360 | $19,423 | $54,937 |
| 2014 | $1,164 | $63,325 | $19,423 | $43,902 |
Source: Public Records
Map
Nearby Homes
- 1113 Country Hills Dr Unit B2
- 1113 Country Hills Dr Unit E1
- 4079 S 895 E Unit 67
- 796 Nancy Dr
- 685 Lavina Dr
- 3925 S Evelyn Rd
- 4785 Panorama Dr
- 1070 40th St
- 3878 Grandview Dr
- 4723 Madison Ave
- 904 39th St
- 3935 Nordin Ave
- 4586 Porter Ave
- 4840 S 1000 E
- 3856 Grandview Dr
- 4685 Porter Ave
- 3828 Quincy Ave
- 1165 Edgewood Dr
- 4014 Porter Ave
- 3845 Nordin Ave
Your Personal Tour Guide
Ask me questions while you tour the home.