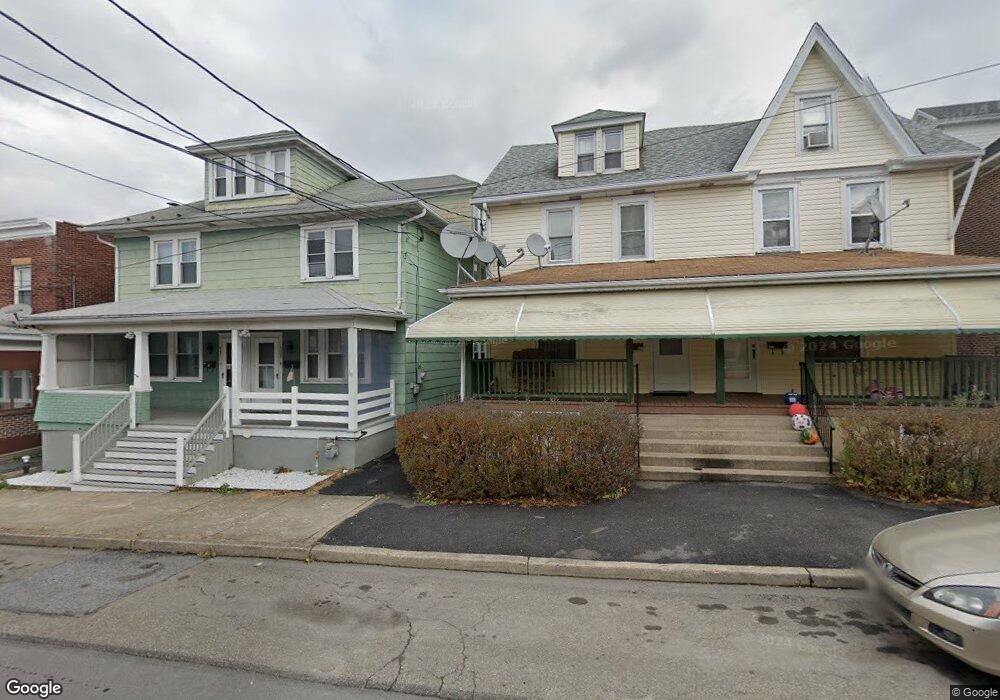
429 Allen St West Hazleton, PA 18202
Estimated Value: $157,000 - $207,227
Studio
--
Bath
3,776
Sq Ft
$50/Sq Ft
Est. Value
About This Home
This home is located at 429 Allen St, West Hazleton, PA 18202 and is currently estimated at $187,307, approximately $49 per square foot. 429 Allen St is a home located in Luzerne County with nearby schools including Hazleton Area High School, Immanuel Christian School, and Bishop Hafey Junior/Senior High School.
Ownership History
Date
Name
Owned For
Owner Type
Purchase Details
Closed on
Jan 18, 2023
Sold by
Steiner David L and Steiner Alice J
Bought by
Dela Rosa Severino Cesar Manuel
Current Estimated Value
Home Financials for this Owner
Home Financials are based on the most recent Mortgage that was taken out on this home.
Original Mortgage
$260,200
Outstanding Balance
$250,296
Interest Rate
6.33%
Mortgage Type
FHA
Estimated Equity
-$62,989
Purchase Details
Closed on
Jul 13, 1972
Bought by
Steiner David L and Steiner Alice J
Create a Home Valuation Report for This Property
The Home Valuation Report is an in-depth analysis detailing your home's value as well as a comparison with similar homes in the area
Home Values in the Area
Average Home Value in this Area
Purchase History
We collect this data history from publicly available records. To have your information removed, we recommend requesting removal directly through your county’s website.
| Date | Buyer | Sale Price | Title Company |
|---|---|---|---|
| Dela Rosa Severino Cesar Manuel | $265,000 | None Listed On Document | |
| Steiner David L | $6,000 | -- |
Source: Public Records
Mortgage History
We collect this data history from publicly available records. To have your information removed, we recommend requesting removal directly through your county’s website.
| Date | Status | Borrower | Loan Amount |
|---|---|---|---|
| Open | Dela Rosa Severino Cesar Manuel | $260,200 |
Source: Public Records
Tax History
| Year | Tax Paid | Tax Assessment Tax Assessment Total Assessment is a certain percentage of the fair market value that is determined by local assessors to be the total taxable value of land and additions on the property. | Land | Improvement |
|---|---|---|---|---|
| 2026 | $1,991 | $71,300 | $20,100 | $51,200 |
| 2025 | $1,798 | $71,300 | $20,100 | $51,200 |
| 2024 | $1,739 | $71,300 | $20,100 | $51,200 |
| 2023 | $1,694 | $71,300 | $20,100 | $51,200 |
| 2022 | $1,681 | $71,300 | $20,100 | $51,200 |
| 2021 | $1,640 | $71,300 | $20,100 | $51,200 |
| 2020 | $1,616 | $71,300 | $20,100 | $51,200 |
| 2019 | $1,491 | $71,300 | $20,100 | $51,200 |
| 2018 | $1,444 | $71,300 | $20,100 | $51,200 |
| 2017 | $1,419 | $71,300 | $20,100 | $51,200 |
| 2016 | -- | $71,300 | $20,100 | $51,200 |
| 2015 | $785 | $71,300 | $20,100 | $51,200 |
| 2014 | $785 | $71,300 | $20,100 | $51,200 |
Source: Public Records
Map
Nearby Homes
Your Personal Tour Guide
Ask me questions while you tour the home.