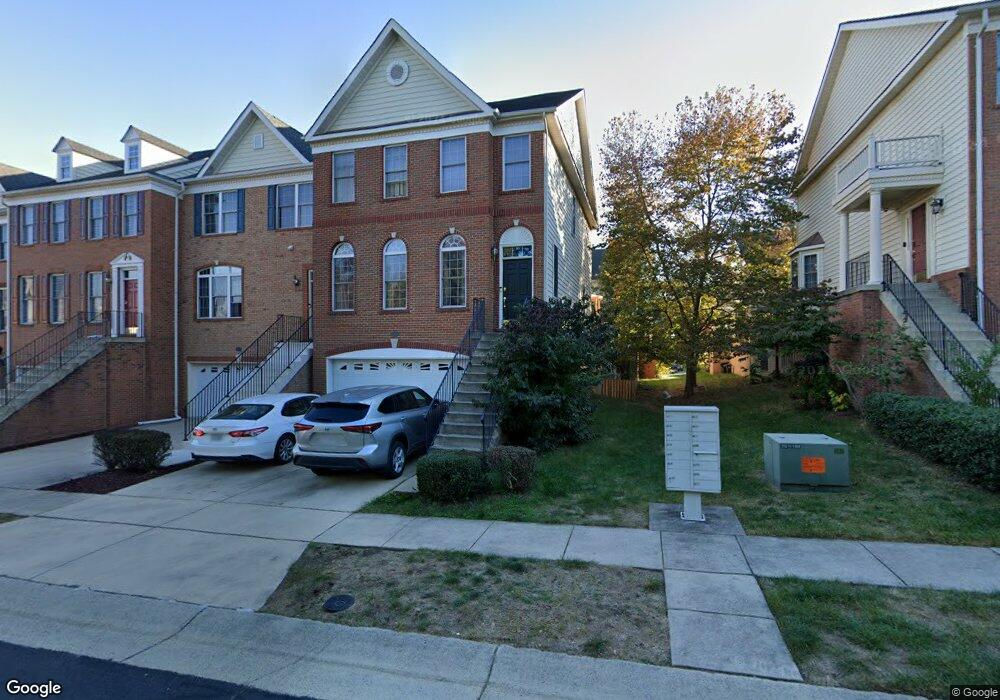
42913 Olander Square Chantilly, VA 20152
Estimated Value: $726,000 - $760,000
About This Home
This home is located at 42913 Olander Square, Chantilly, VA 20152 and is currently estimated at $742,193, approximately $288 per square foot. 42913 Olander Square is a home located in Loudoun County with nearby schools including Cardinal Ridge Elementary School, J. Michael Lunsford Middle School, and Freedom High School.
Ownership History
We collect this data history from publicly available records. To have your information removed, we recommend requesting removal directly through your county’s website.
Purchase Details
Purchase Details
Home Financials for this Owner
Home Financials are based on the most recent Mortgage that was taken out on this home.Purchase Details
Home Financials for this Owner
Home Financials are based on the most recent Mortgage that was taken out on this home.Home Values in the Area
Average Home Value in this Area
Purchase History
We collect this data history from publicly available records. To have your information removed, we recommend requesting removal directly through your county’s website.
| Date | Buyer | Sale Price | Title Company |
|---|---|---|---|
| -- | None Available | ||
| $395,000 | -- | ||
| $340,422 | -- |
Mortgage History
We collect this data history from publicly available records. To have your information removed, we recommend requesting removal directly through your county’s website.
| Date | Status | Borrower | Loan Amount |
|---|---|---|---|
| Open | $387,485 | ||
| Previous Owner | $272,000 |
Tax History
We collect this data history from publicly available records. To have your information removed, we recommend requesting removal directly through your county’s website.
| Year | Tax Paid | Tax Assessment Tax Assessment Total Assessment is a certain percentage of the fair market value that is determined by local assessors to be the total taxable value of land and additions on the property. | Land | Improvement |
|---|---|---|---|---|
| 2025 | $5,522 | $685,920 | $225,000 | $460,920 |
| 2024 | $5,577 | $644,690 | $203,500 | $441,190 |
| 2023 | $5,222 | $596,750 | $203,500 | $393,250 |
| 2022 | $5,209 | $585,280 | $193,500 | $391,780 |
| 2021 | $5,031 | $513,390 | $158,500 | $354,890 |
| 2020 | $4,879 | $471,360 | $138,500 | $332,860 |
| 2019 | $4,678 | $447,610 | $138,500 | $309,110 |
| 2018 | $4,754 | $438,110 | $128,500 | $309,610 |
| 2017 | $4,556 | $405,000 | $128,500 | $276,500 |
| 2016 | $4,513 | $394,120 | $0 | $0 |
| 2015 | $4,464 | $264,780 | $0 | $264,780 |
| 2014 | $4,571 | $277,230 | $0 | $277,230 |
Map
- 25835 Turlough Terrace
- 42960 Spyder Place
- 25765 Howerton Dr
- 25785 Flyaway Ct
- 25758 S Village Dr
- 0 Braddock Rd Unit VALO2086014
- 42598 Unbridleds Song Place
- 42787 Shaler St
- 42788 Cedar Hedge St
- 25554 Mimosa Tree Ct
- 43232 Golf View Dr
- 25781 Planting Field Dr
- 25504 Heathfield Cir
- 25496 Heathfield Cir
- 42716 Rolling Rock Square
- 42647 Harris St
- 25374 Shipley Terrace
- 25371 Shipley Terrace
- 42799 Sykes Terrace
- 42498 Longacre Dr
- 42903 Olander Square
- 42905 Olander Square
- 42901 Olander Square
- 42907 Olander Square
- 42909 Olander Square
- 42900 Overly Square
- 42902 Overly Square
- 42898 Overly Square
- 42904 Overly Square
- 42906 Overly Square
- 42910 Overly Square
- 42915 Olander Square
- 25799 Mandeville Dr
- 42912 Overly Square
- 42917 Olander Square
- 25803 Mandeville Dr
- 42914 Overly Square
- 42919 Olander Square
- 25807 Mandeville Dr
- 42916 Overly Square
Ask me questions while you tour the home.