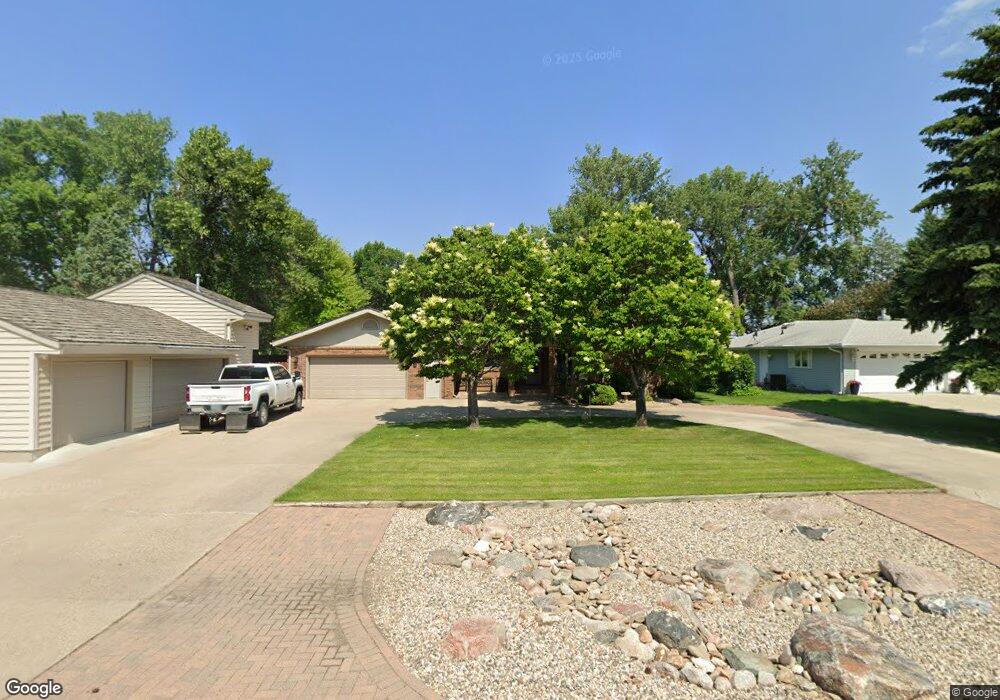
43 Captain Marsh Dr Mandan, ND 58554
Estimated Value: $603,000 - $796,000
3
Beds
2
Baths
2,610
Sq Ft
$275/Sq Ft
Est. Value
About This Home
This home is located at 43 Captain Marsh Dr, Mandan, ND 58554 and is currently estimated at $717,440, approximately $274 per square foot. 43 Captain Marsh Dr is a home located in Morton County with nearby schools including Lewis & Clark Elementary School, Mandan Middle School, and Mandan High School.
Ownership History
Date
Name
Owned For
Owner Type
Purchase Details
Closed on
Aug 1, 2012
Sold by
Russell Evelyn
Bought by
Schepp Wayne R and Schepp Candace K
Current Estimated Value
Home Financials for this Owner
Home Financials are based on the most recent Mortgage that was taken out on this home.
Original Mortgage
$297,000
Outstanding Balance
$34,008
Interest Rate
3.92%
Mortgage Type
New Conventional
Estimated Equity
$683,432
Create a Home Valuation Report for This Property
The Home Valuation Report is an in-depth analysis detailing your home's value as well as a comparison with similar homes in the area
Home Values in the Area
Average Home Value in this Area
Purchase History
| Date | Buyer | Sale Price | Title Company |
|---|---|---|---|
| Schepp Wayne R | $540,000 | None Available |
Source: Public Records
Mortgage History
| Date | Status | Borrower | Loan Amount |
|---|---|---|---|
| Open | Schepp Wayne R | $297,000 |
Source: Public Records
Tax History
| Year | Tax Paid | Tax Assessment Tax Assessment Total Assessment is a certain percentage of the fair market value that is determined by local assessors to be the total taxable value of land and additions on the property. | Land | Improvement |
|---|---|---|---|---|
| 2025 | $4,642 | $348,000 | $67,200 | $280,800 |
| 2024 | $66 | $321,100 | $0 | $0 |
| 2023 | $6,288 | $325,950 | $67,200 | $258,750 |
| 2022 | $4,584 | $242,250 | $41,700 | $200,550 |
| 2021 | $4,251 | $226,400 | $46,400 | $180,000 |
| 2020 | $3,953 | $222,950 | $46,400 | $176,550 |
| 2019 | $3,959 | $218,950 | $0 | $0 |
| 2018 | $3,795 | $218,700 | $46,400 | $172,300 |
| 2017 | $4,014 | $215,500 | $46,400 | $169,100 |
| 2016 | $3,707 | $204,450 | $46,400 | $158,050 |
| 2015 | $3,549 | $195,700 | $46,400 | $149,300 |
| 2014 | $3,739 | $202,600 | $48,700 | $153,900 |
| 2013 | $3,606 | $187,600 | $46,400 | $141,200 |
Source: Public Records
Map
Nearby Homes
- 2207 Bridgeview Ct
- 2313 Pirates Loop SE
- 4500 Sundancer Loop SE Unit 2
- 566 Sunset Place
- 2120 Sundancer Loop SE Unit 5
- 2445 Waterpark Loop SE
- 2454 Waterpark Loop SE
- 1005 W Highland Acres Rd
- 1120 Keating Dr
- 2617 Verity Ln SE
- 2616 Douglas Place SE
- 2601 Douglas Place SE
- 2806 Waters Edge Ln SE
- 2625 Douglas Place SE
- 1009 Lake Ave
- 3714 Amity Cir SE
- 3834 Gale Cir SE
- 3812 24th St SE
- 1232 E Coulee Rd
- 3801 Gale Cir SE
- 44 Captain Marsh Dr
- 0 Captain Marsh Dr
- 42 Captain Marsh Dr
- 45 Captain Marsh Dr
- 41 Captain Marsh Dr
- 55 Captain Marsh Dr
- 54 Captain Marsh Dr
- 53 Captain Marsh Dr
- 46 Captain Marsh Dr
- 40 Captain Marsh Dr
- 52 Captain Marsh Dr
- 47 Captain Marsh Dr
- 39 Captain Marsh Dr
- 51 Captain Marsh Dr
- 48 Captain Marsh Dr
- 62 Captain Leach Dr
- 50 Captain Marsh Dr
- 58 Captain Marsh Dr
- 38 Captain Marsh Dr
- 59 Captain Marsh Dr
Your Personal Tour Guide
Ask me questions while you tour the home.