43 Corning Rd Norwich, CT 06360
Central Norwich NeighborhoodEstimated Value: $233,000 - $260,000
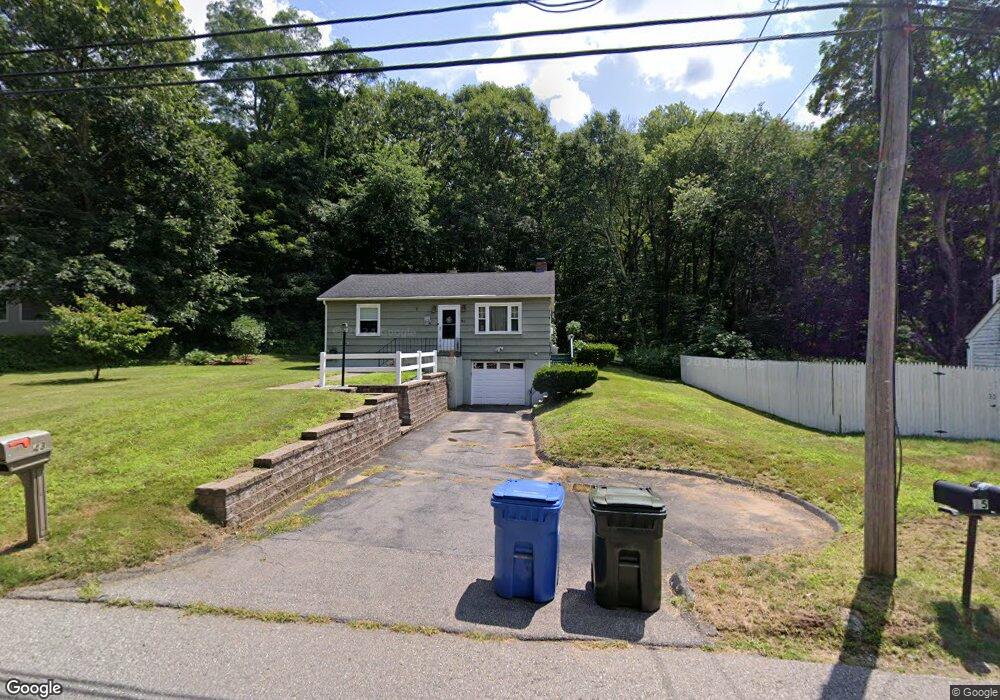
About This Home
This home is located at 43 Corning Rd, Norwich, CT 06360 and is currently estimated at $250,881, approximately $218 per square foot. 43 Corning Rd is a home located in New London County with nearby schools including Veterans' Memorial Elementary School, Kelly STEAM Magnet Middle School, and Integrated Day Charter School.
Ownership History
We collect this data history from publicly available records. To have your information removed, we recommend requesting removal directly through your county’s website.
Purchase Details
Home Financials for this Owner
Home Financials are based on the most recent Mortgage that was taken out on this home.Purchase Details
Home Values in the Area
Average Home Value in this Area
Purchase History
We collect this data history from publicly available records. To have your information removed, we recommend requesting removal directly through your county’s website.
| Date | Buyer | Sale Price | Title Company |
|---|---|---|---|
| $129,900 | -- | ||
| $129,900 | -- | ||
| $205,000 | -- | ||
| $205,000 | -- |
Mortgage History
We collect this data history from publicly available records. To have your information removed, we recommend requesting removal directly through your county’s website.
| Date | Status | Borrower | Loan Amount |
|---|---|---|---|
| Open | $103,000 | ||
| Closed | $103,000 | ||
| Previous Owner | $170,000 |
Tax History
We collect this data history from publicly available records. To have your information removed, we recommend requesting removal directly through your county’s website.
| Year | Tax Paid | Tax Assessment Tax Assessment Total Assessment is a certain percentage of the fair market value that is determined by local assessors to be the total taxable value of land and additions on the property. | Land | Improvement |
|---|---|---|---|---|
| 2025 | $5,524 | $136,500 | $39,000 | $97,500 |
| 2024 | $5,214 | $136,500 | $39,000 | $97,500 |
| 2023 | $3,570 | $73,400 | $19,300 | $54,100 |
| 2022 | $3,558 | $73,400 | $19,300 | $54,100 |
| 2021 | $3,570 | $73,400 | $19,300 | $54,100 |
| 2020 | $3,558 | $73,400 | $19,300 | $54,100 |
| 2019 | $3,522 | $73,400 | $19,300 | $54,100 |
| 2018 | $3,228 | $66,700 | $18,200 | $48,500 |
| 2017 | $3,251 | $66,700 | $18,200 | $48,500 |
| 2016 | $3,272 | $66,700 | $18,200 | $48,500 |
| 2015 | $3,206 | $66,700 | $18,200 | $48,500 |
| 2014 | $3,064 | $66,700 | $18,200 | $48,500 |
Map
- 168 Corning Rd
- 0 Palmer St
- 687 N Main St
- 37 39 41 N Main St
- 41 Palmer St Unit 22
- 41 Palmer St Unit 9
- 110 N Main St
- 358 Hamilton Ave Unit 14
- 45 Hedge Ave
- 617 E Main St
- 68 Corning Rd
- 84 Corning Rd
- 105 Stonington Rd
- 111 5th St
- 0 7th St
- 17 Ripley Place
- 39 Tanner Ave
- 168 Boswell Ave
- 40 N Main St
- 21 Daniel St
Ask me questions while you tour the home.