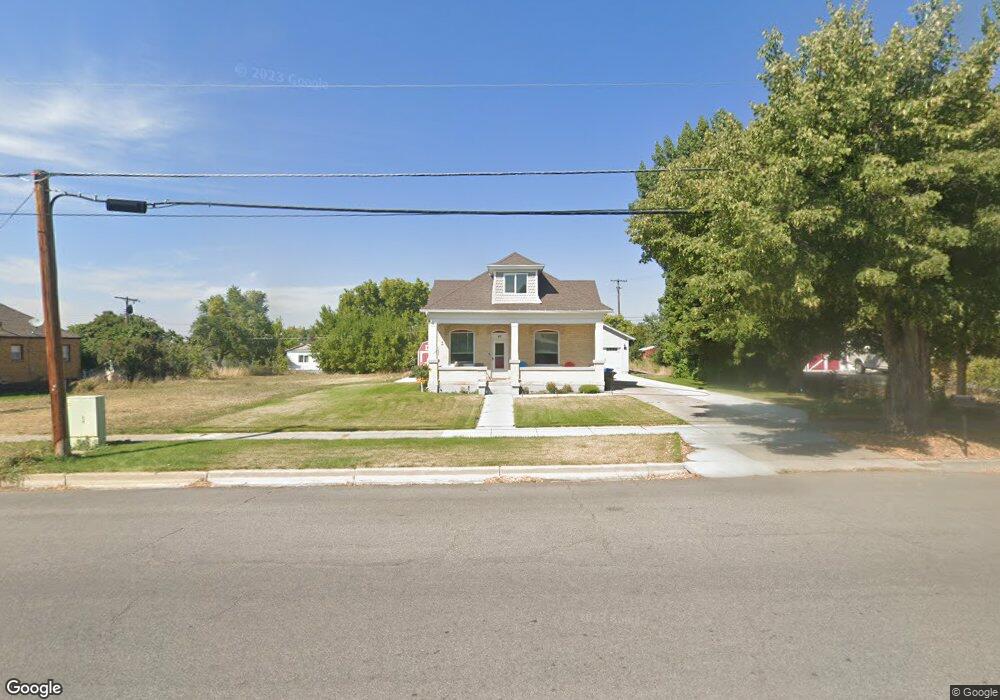
43 E 100 N Smithfield, UT 84335
Estimated Value: $427,000 - $507,000
Studio
--
Bath
2,591
Sq Ft
$180/Sq Ft
Est. Value
About This Home
This home is located at 43 E 100 N, Smithfield, UT 84335 and is currently estimated at $466,746, approximately $180 per square foot. 43 E 100 N is a home located in Cache County with nearby schools including Summit School, North Cache Middle School, and White Pine Middle School.
Ownership History
Date
Name
Owned For
Owner Type
Purchase Details
Closed on
Mar 3, 2022
Sold by
Kowallis David S
Bought by
Kowallis David S and Litchford David O
Current Estimated Value
Purchase Details
Closed on
Aug 6, 2017
Sold by
Mcmorris John and Mcmorris Diane
Bought by
Smith Trevor and Smith Hannah
Home Financials for this Owner
Home Financials are based on the most recent Mortgage that was taken out on this home.
Original Mortgage
$203,250
Interest Rate
4.12%
Mortgage Type
FHA
Create a Home Valuation Report for This Property
The Home Valuation Report is an in-depth analysis detailing your home's value as well as a comparison with similar homes in the area
Home Values in the Area
Average Home Value in this Area
Purchase History
| Date | Buyer | Sale Price | Title Company |
|---|---|---|---|
| Kowallis David S | -- | Inwest Title | |
| Smith Trevor | -- | None Available |
Source: Public Records
Mortgage History
| Date | Status | Borrower | Loan Amount |
|---|---|---|---|
| Previous Owner | Smith Trevor | $203,250 |
Source: Public Records
Tax History
| Year | Tax Paid | Tax Assessment Tax Assessment Total Assessment is a certain percentage of the fair market value that is determined by local assessors to be the total taxable value of land and additions on the property. | Land | Improvement |
|---|---|---|---|---|
| 2025 | $1,833 | $245,410 | $0 | $0 |
| 2023 | $2,059 | $244,560 | $0 | $0 |
| 2022 | $2,036 | $237,900 | $0 | $0 |
| 2021 | $1,843 | $328,960 | $70,000 | $258,960 |
| 2020 | $1,617 | $269,200 | $70,000 | $199,200 |
| 2019 | $1,538 | $244,200 | $45,000 | $199,200 |
| 2018 | $1,353 | $207,700 | $45,000 | $162,700 |
| 2017 | $680 | $57,035 | $0 | $0 |
| 2016 | $692 | $57,035 | $0 | $0 |
| 2015 | $695 | $57,035 | $0 | $0 |
| 2014 | $681 | $57,035 | $0 | $0 |
| 2013 | -- | $57,035 | $0 | $0 |
Source: Public Records
Map
Nearby Homes
Your Personal Tour Guide
Ask me questions while you tour the home.