43 Maple St Massapequa, NY 11758
Estimated Value: $898,623 - $991,000
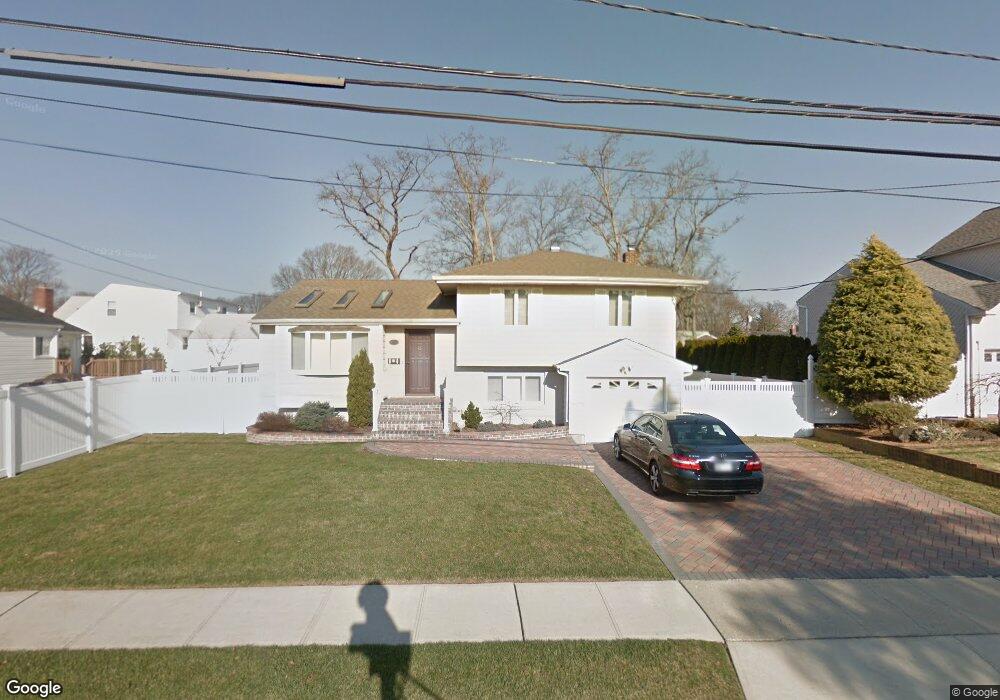
About This Home
This home is located at 43 Maple St, Massapequa, NY 11758 and is currently estimated at $944,812, approximately $491 per square foot. 43 Maple St is a home located in Nassau County with nearby schools including Massapequa High School - Ames Campus, Berner Middle School, and Massapequa High School.
Ownership History
We collect this data history from publicly available records. To have your information removed, we recommend requesting removal directly through your county’s website.
Purchase Details
Home Financials for this Owner
Home Financials are based on the most recent Mortgage that was taken out on this home.Purchase Details
Home Financials for this Owner
Home Financials are based on the most recent Mortgage that was taken out on this home.Home Values in the Area
Average Home Value in this Area
Purchase History
We collect this data history from publicly available records. To have your information removed, we recommend requesting removal directly through your county’s website.
| Date | Buyer | Sale Price | Title Company |
|---|---|---|---|
| $719,000 | Judicial Title | ||
| $215,000 | -- |
Mortgage History
We collect this data history from publicly available records. To have your information removed, we recommend requesting removal directly through your county’s website.
| Date | Status | Borrower | Loan Amount |
|---|---|---|---|
| Open | $575,200 | ||
| Previous Owner | $172,000 |
Tax History
We collect this data history from publicly available records. To have your information removed, we recommend requesting removal directly through your county’s website.
| Year | Tax Paid | Tax Assessment Tax Assessment Total Assessment is a certain percentage of the fair market value that is determined by local assessors to be the total taxable value of land and additions on the property. | Land | Improvement |
|---|---|---|---|---|
| 2026 | $16,526 | $570 | $179 | $391 |
| 2025 | $16,526 | $580 | $182 | $398 |
| 2024 | $4,905 | $596 | $187 | $409 |
| 2023 | $15,595 | $628 | $197 | $431 |
| 2022 | $15,595 | $647 | $203 | $444 |
| 2021 | $15,172 | $624 | $196 | $428 |
| 2020 | $13,636 | $662 | $506 | $156 |
| 2019 | $3,420 | $662 | $474 | $188 |
| 2018 | $5,335 | $706 | $0 | $0 |
| 2017 | $5,335 | $750 | $478 | $272 |
| 2016 | $8,618 | $794 | $456 | $338 |
| 2015 | $3,113 | $838 | $481 | $357 |
| 2014 | $3,113 | $838 | $481 | $357 |
| 2013 | $2,906 | $882 | $506 | $376 |
Map
- 59 Cedar St
- 61 Cedar St
- 54 Chestnut St
- 346 Seaford Ave
- 340 Seaford Ave
- 3 Cherry St
- 117 Washington Place
- 412 Seaford Ave
- 280 Division Ave
- 386 Harrison Ave
- 2097 Washington Ave
- 378 Harrison Ave
- 256 Division Ave
- 399 Ocean Ave
- 2181 Hortense Ave
- 112 Harrison Place
- 119 Alhambra Rd
- 4530 Merrick Rd
- 3937 John Ln
- 1885 Washington Ave
Ask me questions while you tour the home.